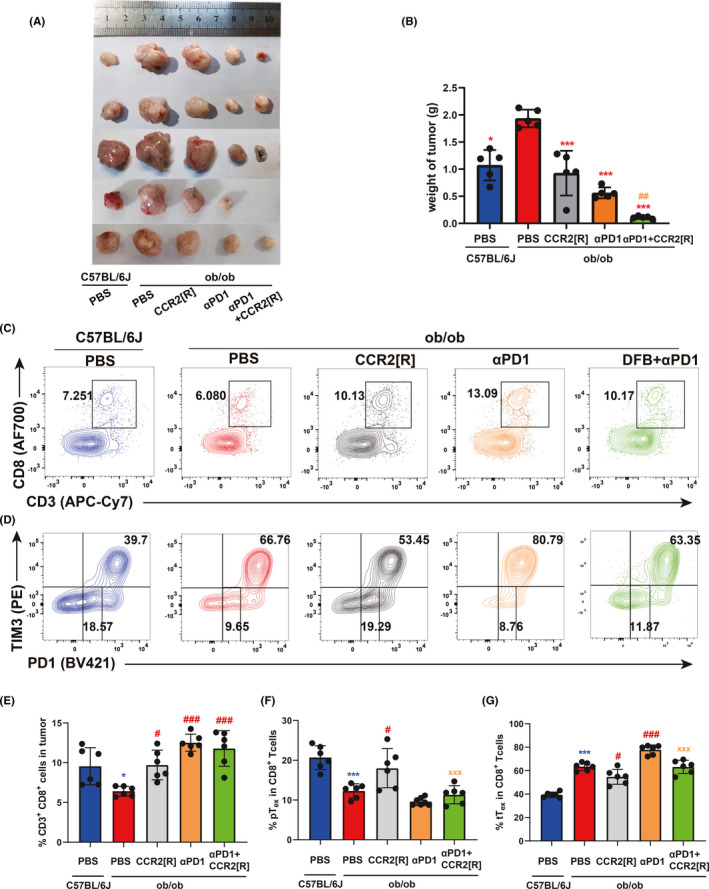
FIGURE 5.

CCR2 inhibitor suppresses the shift from pTex to tTex. (A) Tumor weight of MC38 subcutaneously inoculated in 8‐week‐old C57BL/6J (n = 5) and ob/ob (n = 5) male mice. Tumor weight depicted as mean ± SEM. (B) Statistical chart of the tumor weight in each group (n = 5 per group). (C) Representative flow plots of CD3+ CD8+ ratio in tumor‐bearing mice in each group (Above); Representative flow plots of PD1 and TIM3 ratio in tumor‐bearing mice in each group (Below). (D) Statistical chart of the ratio of CD3+ CD8+ in tumor infiltration each group (n = 5 per group). (E) Statistical chart of the ratio of terminal exhausted T cells (tTex) and progenitor exhausted T cells (pTex) in the tumor‐infiltrating CD8+ T cells of each group (n = 5 per group). (F) Statistical chart of the ratio of tTex and pTex in the tumor‐infiltrating CD8+ T cells of each group (n = 5 per group). Compared with C57BL/6J (PBS) group, *p < 0.05; **p < 0.01; ***p < 0.001. Compared with ob/ob (PBS) group, # p < 0.05; ## p < 0.01; ### p < 0.001. Compared with ob/ob (αPD1+CCR2‐RA‐[R]) group, xx p < 0.01. Data in this figure are all depicted as mean ± SEM, with all individual points shown. Ordinary one‐way ANOVA p values are shown
