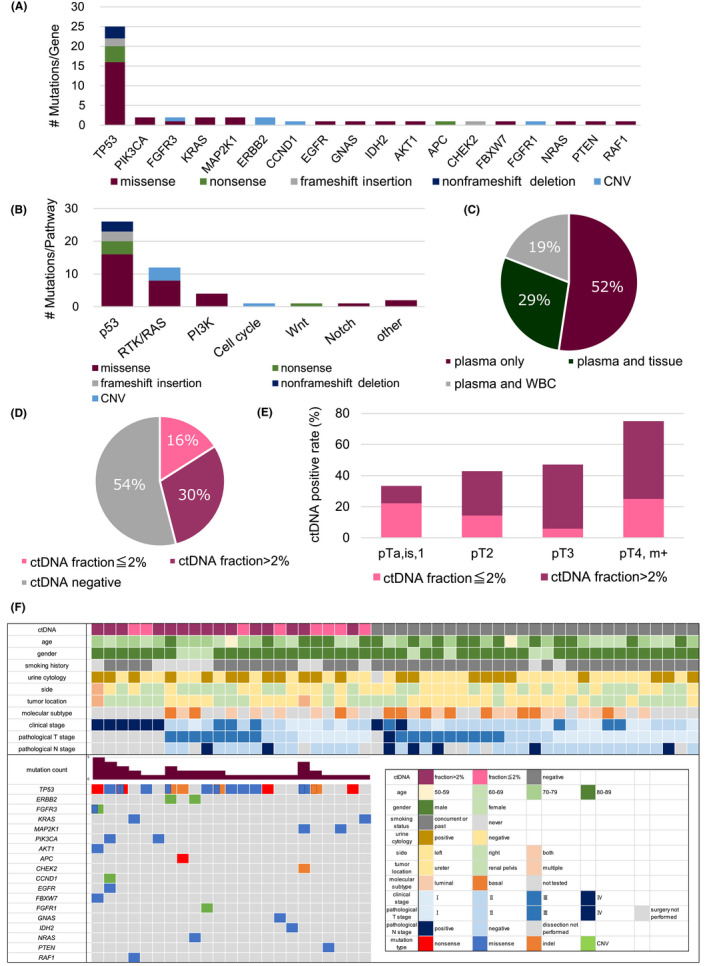
FIGURE 2.

Identification of circulating tumor DNA (ctDNA) variants in plasma cell‐free DNA (cfDNA). Distribution graphs depict genomic alterations (A) and classification of oncogenic signaling pathways (B) of plasma cfDNA variants detected in 25 patients with upper tract urothelial carcinoma. (C). Pie chart showing the rate of concordance between TP53 mutations in plasma cfDNA and tumor DNA or WBC DNA. (D). Pie chart showing the positivity rate of ctDNA in 50 patients with UTUC after exclusion of false positives. (E). Bar chart showing ctDNA positivity rate at different histopathological stages. Patients with metastatic cancer (m+) were classified into the pT4 group because their pathological stage was not obtained and they had a poor prognosis. (F). Clinicopathological demographics of cases, colored according to their categorization (bottom right) for ctDNA‐positive (top left) and ctDNA‐negative groups (top right), respectively. The mutational landscape of each patient in the ctDNA‐positive group is also shown (bottom left). Clinical stage Ⅳ means cancers with metastasis
