
FIGURE 4.
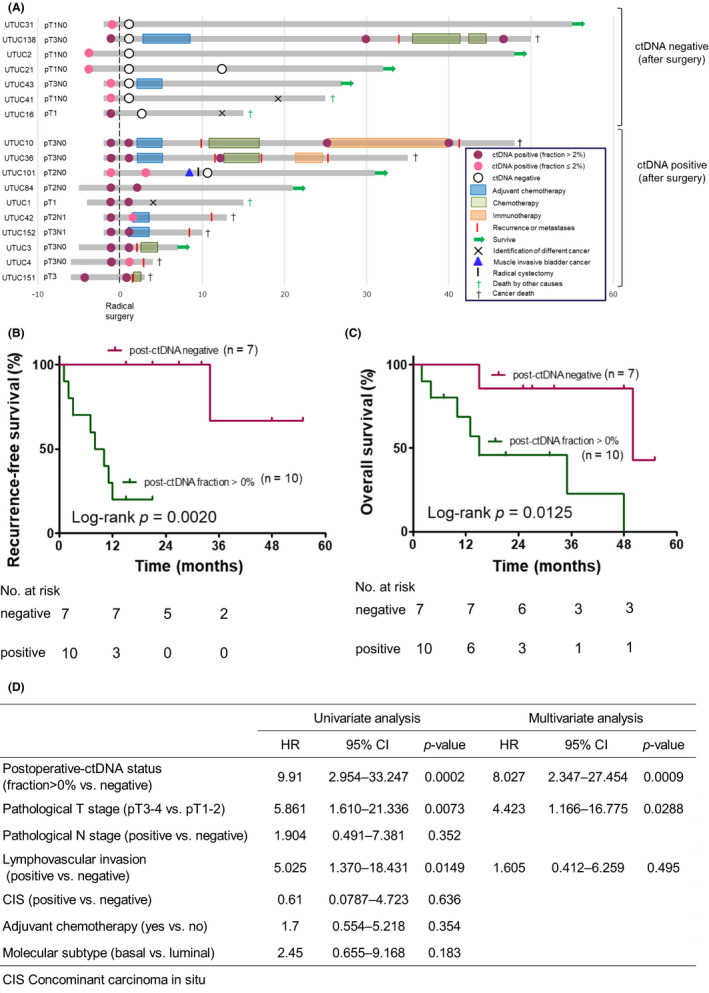
(A) Longitudinal monitoring of ctDNA levels during clinical disease course in patients with nonmetastatic UTUC. Individual swimmer plots for each patient showing the duration of treatment after surgery for the ctDNA‐negative cohort (upper panel, n = 7) and the ctDNA‐positive cohort (lower panel, n = 10). Horizontal lines represent the clinical course of each patient. Circles represent ctDNA status (red and white circles mean positive and negative, respectively). Red bars indicate recurrence or metastasis as evaluated by radiological images. Patients UTUC41, UTUC16, and UTUC1 developed cholangiocarcinoma, acute lymphocytic leukemia (ALL), and esophageal cancer, respectively. Postoperative ctDNA and recurrence‐free survival (RFS)/overall survival (OS) using Kaplan–Meier survival estimates. RFS (HR =9.26, 95% CI =2.25–38.10, p = 0.0020; (B)) and OS (HR =6.26, 95% CI =1.49–26.38, p = 0.013; (C)) in postoperative ctDNA detectable (n = 10) versus undetectable (n = 7). (D) Multivariate analysis results are shown