
FIGURE 5.
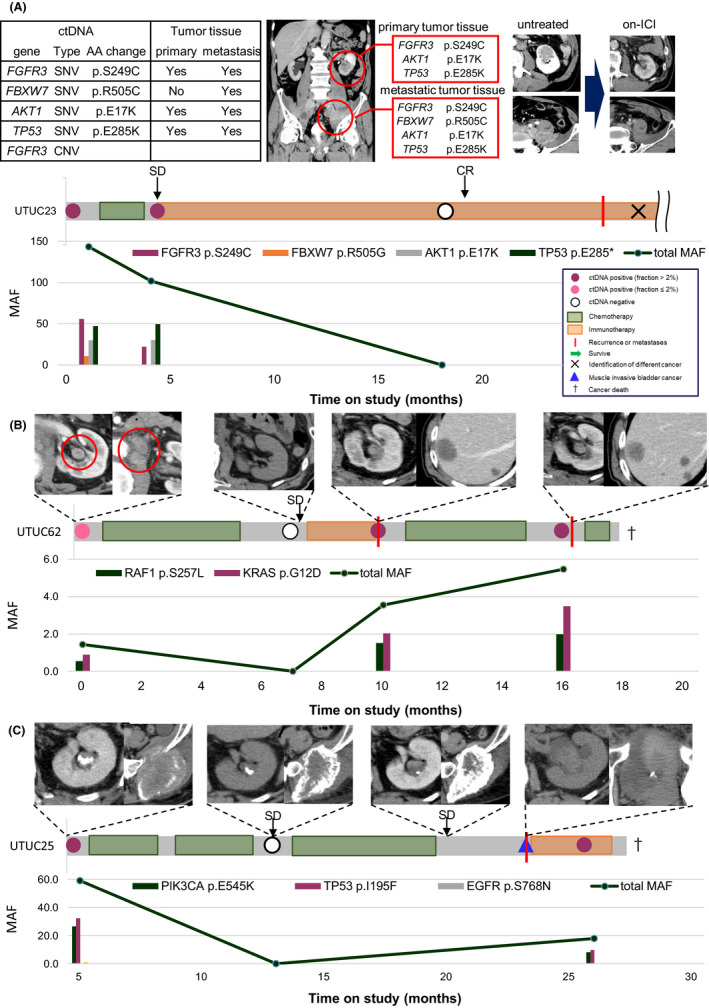
(A–C) Longitudinal monitoring of ctDNA levels during the clinical disease course in patients with metastases. The horizontal bar chart represents the clinical course and indicates the events of blood collection, treatment, and so on, as explained in the associated inlet. Zero indicates the first day to draw plasma in patients with UTUC. The black arrows show the evaluation of the target lesions after treatment according to the RECIST criteria by radiological imaging. The vertical bar chart shows the mutant allele frequency (MAF) of each detected ctDNA, and the line graph shows the total MAF of detected ctDNAs