FIGURE 1.

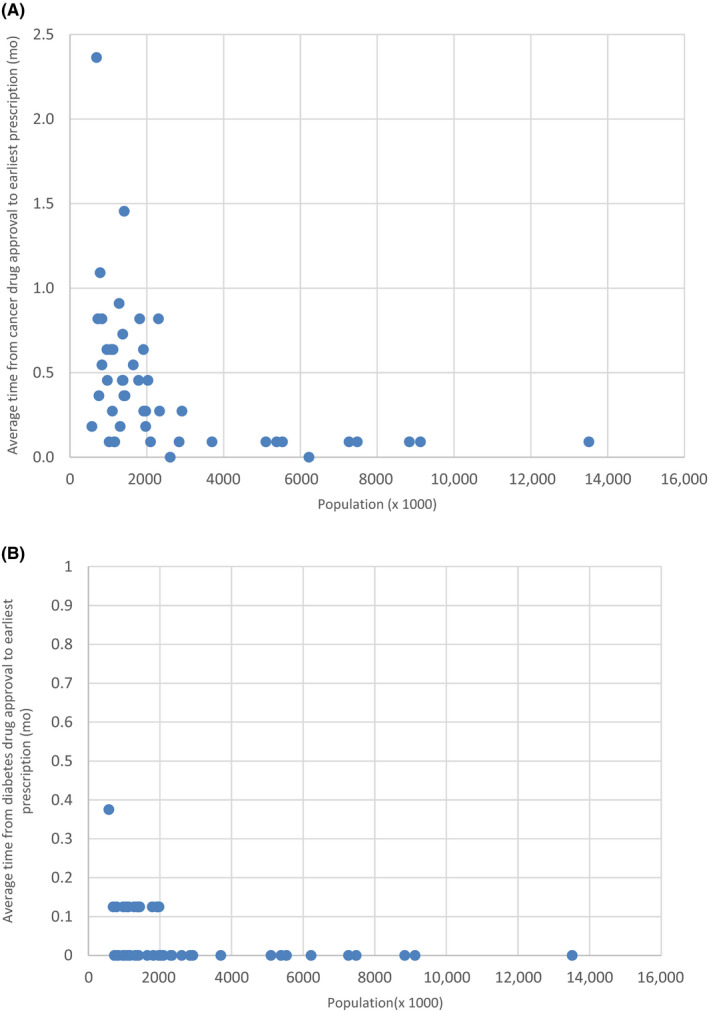
Relationship between population size and average time lag (months) from approval to earliest prescriptions across (A) 11 cancer drugs and (B) eight diabetes drugs in each Japanese prefecture. Each dot represents a prefecture

Relationship between population size and average time lag (months) from approval to earliest prescriptions across (A) 11 cancer drugs and (B) eight diabetes drugs in each Japanese prefecture. Each dot represents a prefecture