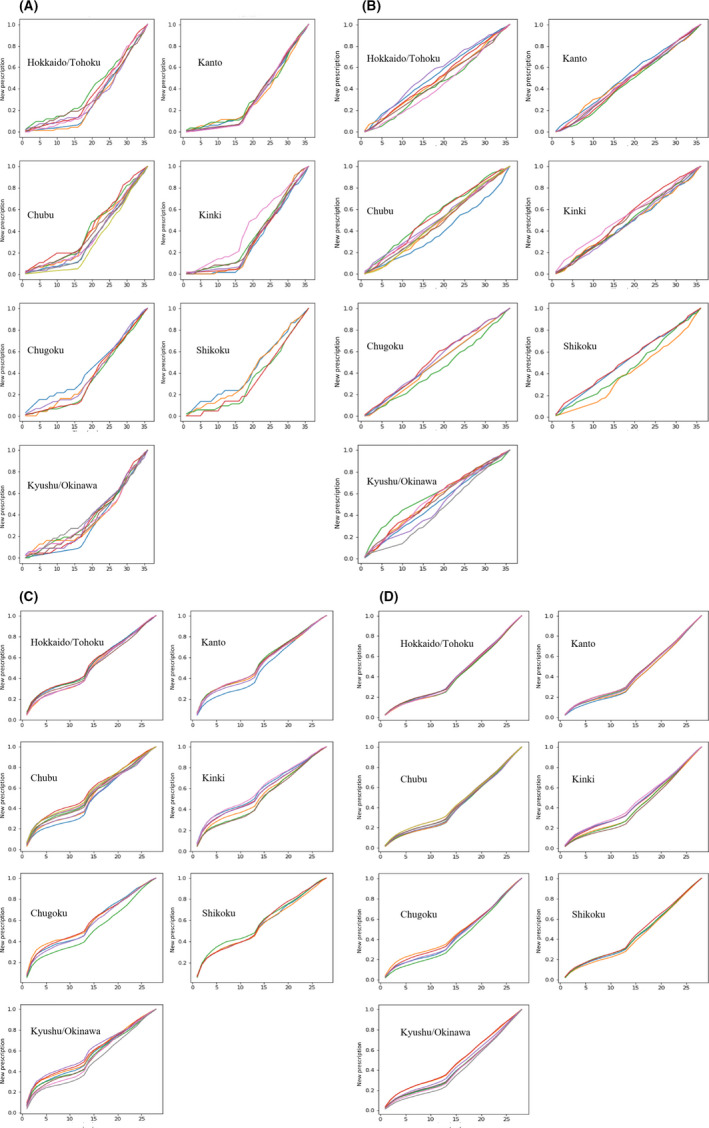
FIGURE 2.

(A) Cumulative number of new nivolumab prescriptions in each geographic region in Japan (first month, Sep 2014). Each line represents a prefecture in the region. (B) Cumulative number of new degarelix acetate prescriptions in each geographic region (first month, Dec 2012). Each line represents a prefecture in the region. (C) Cumulative number of new ipragliflozin prescriptions in each geographic region (first month, Apr 2014). Each line represents a prefecture in the region. (D) Cumulative number of all new diabetes drug prescriptions in each geographic region. Each line represents a prefecture in the region
