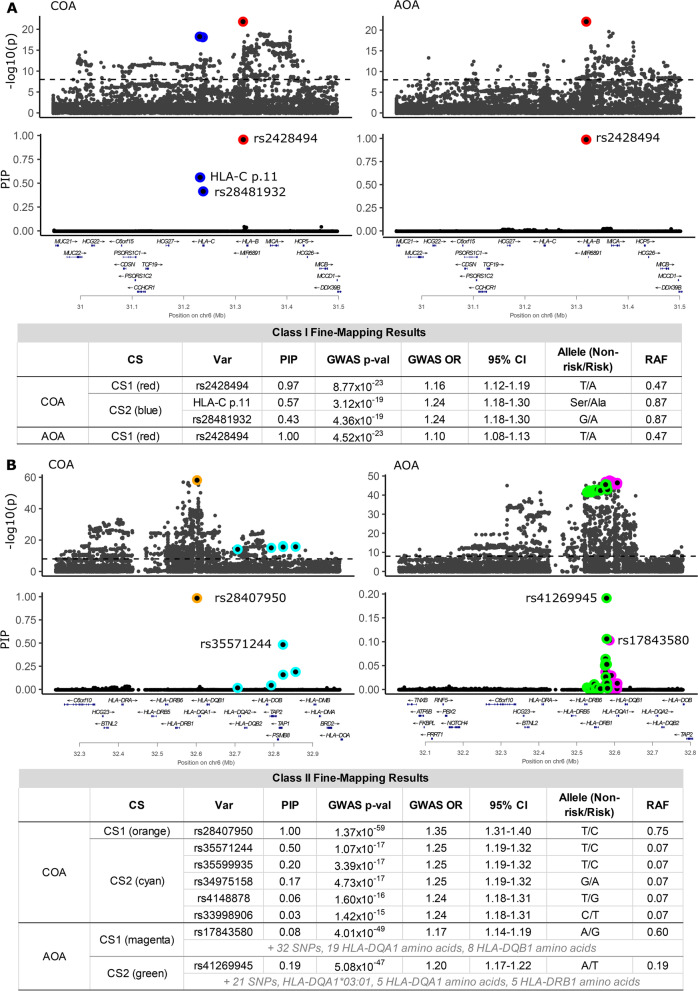
Fig. 1.
Fine-mapping results for childhood- and adult-onset asthma. In the A HLA class I and B HLA class II region, the upper panels show the −log10(p-values) from the GWAS [3]; the dashed line indicates genome-wide significance. The lower panels show the fine-mapping probabilities (PIPs) for the same variants. The colors represent the level-95% credible sets (HLA class I: CS1=red, CS2=blue; HLA class II CS1=orange and CS2=cyan for COA, and CS1=magenta, CS2=green for AOA). The tables show summaries of the variants in each credible set. A total of 9021 variants (SNPs, HLA alleles, amino acid polymorphisms) were examined in the class I region and 10,428 variants in the class II region

