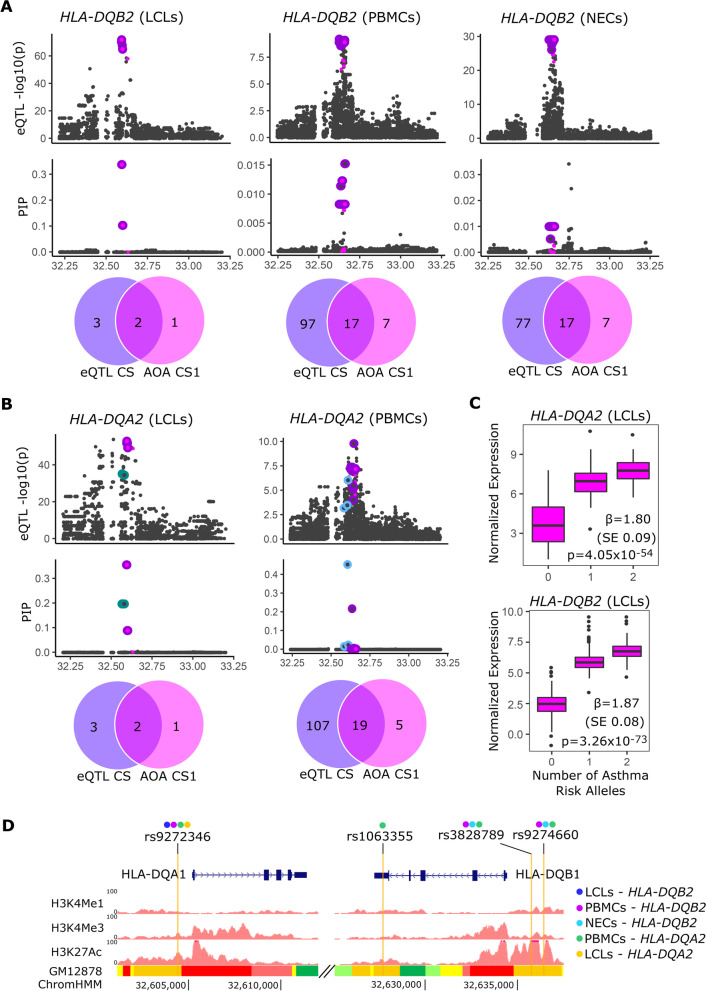
Fig. 2.
eQTL fine-mapping and functional annotations. For A HLA-DQB2 and B HLA-DQA2, upper panels show eQTL −log10(p-values) and PIPs for each variant tested within ± 0.5 Mb of the gene TSS. The colored outlines show the eQTL credible sets; the magenta points are SNPs that were also in the class II AOA CS1. A purple outline around a magenta point shows the variants shared between the eQTL credible set and the class II AOA CS1. The green and blue outlines indicate other credible sets. X-axis position is in Mb (hg19). The Venn diagrams show the number of variants in the eQTL credible set and the number that overlaps with SNPs in the class II AOA CS1. C Normalized expression of HLA-DQA2 (upper panel) and HLA-DQB2 (lower-panel) in LCLs by the number of asthma-risk alleles (A) for rs9272346, a representative class II AOA CS1 SNP. D Four SNPs in the class II AOA CS1 and in one or more eQTL credible set overlapped with functional annotations. The colors above each rsID indicate which eQTL credible set they were in. All four SNPs overlapped with strong enhancers in GM12878 cells (LCLs; bottom track). The GM12878 ChromHMM results correspond to active promoters (red), weak promoters (light red), strong enhancers (orange), weak/poised enhancers (yellow), transcriptional transition/elongation (dark green), and weak transcription (light green). Modified from http://genome.ucsc.edu [47]

