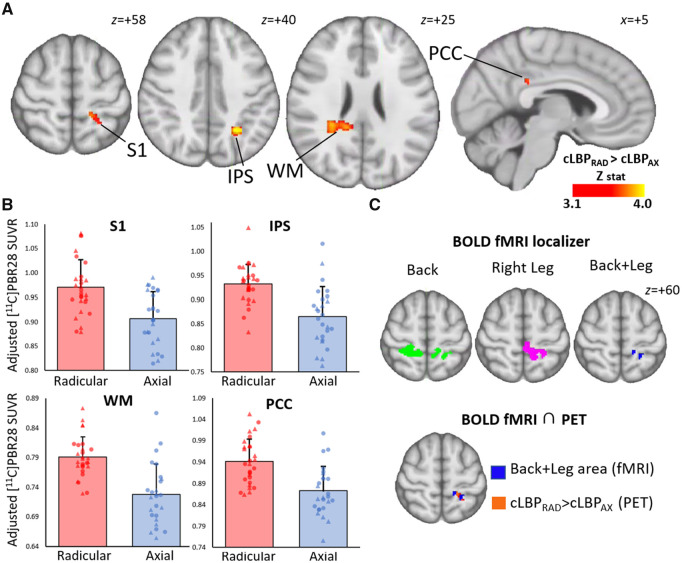
Figure 2.
Voxel-wise group differences in 11C-PBR28 signal. (A) Maps displaying areas with significantly elevated 11C-PBR28 SUVR in cLBPRAD compared to cLBPAX in a voxelwise analysis, adjusted for protocol and genotype. (B) Average ± SD SUVR extracted from several clusters identified as statistically significant in the voxelwise SUVR analysis from A (adjusted for scanner and genotype). The range of the y-axis is set depending on the distribution of individual data-points. (C) BOLD functional MRI localizing the somatotopic representation of S1 area for the Back+Leg and the overlap between Back+Leg e-stim and 11C-PBR28 SUVR signal in cLBPRAD > cLBPAX. IPS = intraparietal sulcus; PCC = posterior cingulate cortex; WM = white matter. Triangle denotes data from Protocol 1, circle denotes data from Protocol 2.

