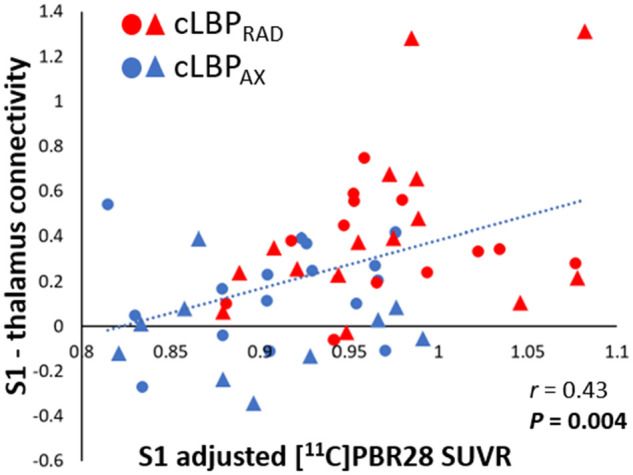
Figure 4.

S1 11C-PBR28 signal correlates with S1-thalamus connectivity. The 11C-PBR28 SUVR signal was extracted from the S1 cluster that was significant in the PET group comparisons (Fig. 2). Connectivity scores were extracted from the thalamic cluster that was significant in the S1 connectivity analyses (Fig. 3). All data have been adjusted for protocol and genotype. Triangle denotes data from Protocol 1, circle denotes data from Protocol 2. The range of the y-axis is set depending on the distribution of individual data-points.
