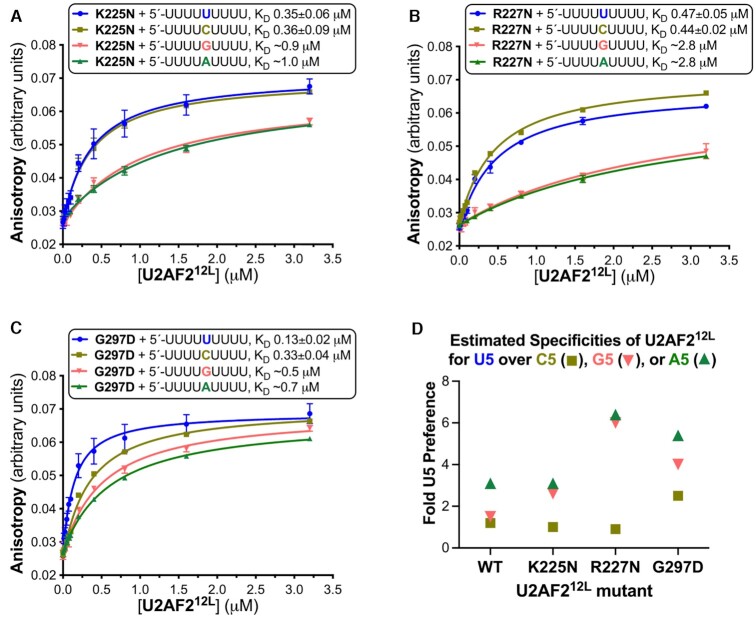
Figure 6.
U2AF2 residues at the RNA interface influence its specificity for the central nucleotide. (A–C) Average fluorescence anisotropy data points and standard deviations from three replicates of the indicated U2AF212L mutants titrated into 5′-fluorescein-labeled RNA oligonucleotides. The fitted curves are overlaid. The RNA sequences comprising nine-uridines (blue) or its C5, G5 or A5 variants (mustard, salmon, or green), are inset alongside the apparent equilibrium dissociation constants (KD) and standard deviations. (D) Scatter graph of the ratios of the wild-type or mutant U2AF212L binding affinities for U5 to the affinities for the C5 (square), G5 (inverted triangle), or A5 (triangle) variants of the central nucleotide. The KD’s and specificities of the U2AF2 variants binding the G5 and A5 RNAs are estimates due to the very low affinities. Supplementary Figure S2 shows penalties of K225E or R227E mutations on U2AF212L–RNA binding.

