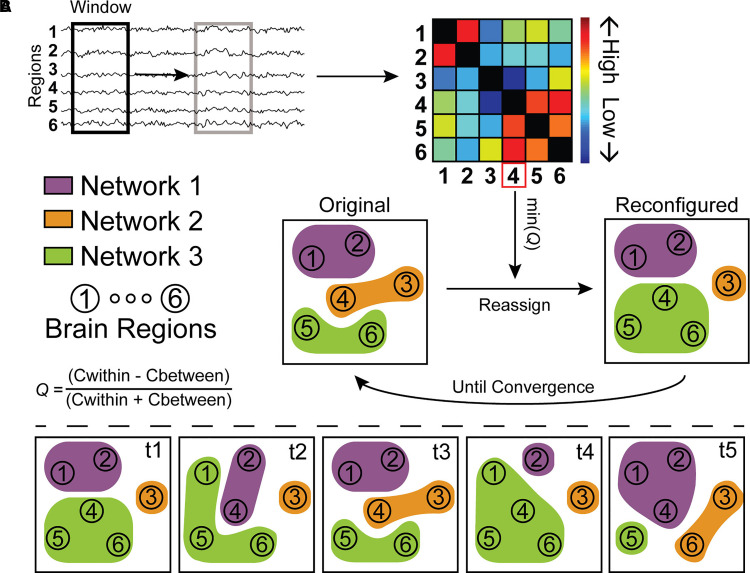
Figure 1.
A simplified illustration of the assignment of brain regions to networks and quantification of reconfiguration dynamics as used in this study. (A) The pre-processed fMRI data was cut into smaller overlapping windows and connectivity was calculated between all regions within that window, resulting in a connectivity matrix for each window. Initially, the assignment of brain regions to networks is based on literature-derived networks, but this is iteratively updated by identifying the region with worst assignment using the original assignment, min(Q), and reassigning it to the network with which assignment quality would be maximized. This iterative reassignment is performed until the same regions is selected to have worst assignment two times in a row, signalling convergence. (B) Then, we could quantify network reconfiguration over time (from t1 to t5 in this example) using four measures. Promiscuity quantifies how many networks a region was assigned to, e.g. 2/3 for region 1 and 3/3 for region 4. Flexibility quantifies how many times a region was reassigned over time, e.g. (4/4=)1 for region 1 and 1/4 for region 6. Cohesion quantifies how many of these flexible reconfigurations are made together with another region, e.g. region 1 and region 4 switch assignment together from t4 to t5. Finally, disjointedness quantifies how many reconfigurations are made independently, all other switches in this example are independent switches.

