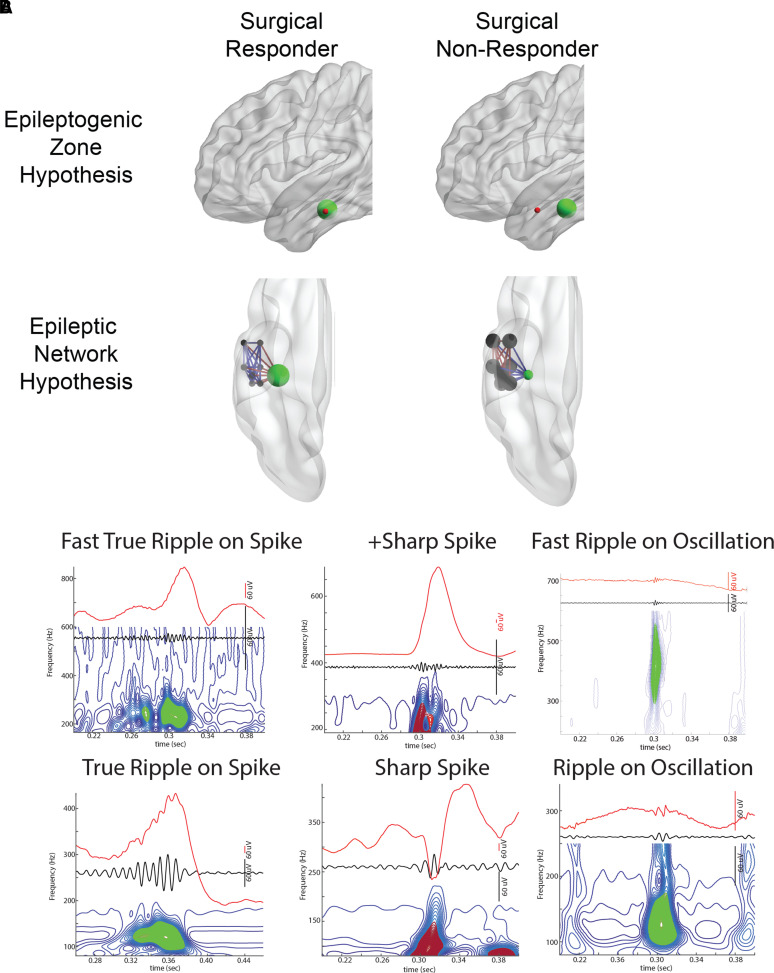
Figure 1.
Illustration of two potential mechanisms accounting for epilepsy surgery failure and HFO and spike biomarkers. (A) In the EZ hypothesis, the EZ (red) is necessary and sufficient for seizure generation. When the EZ overlaps with the SOZ (green), and the SOZ is resected, the patient is a surgical responder. However, if the EZ is discordant with the SOZ, and the SOZ is resected instead of the EZ, the patient will be a surgical non-responder. In the epileptic network hypothesis, the nodes of the epileptic network (black) are connected to each other by weighted connections. If the SOZ node (green) is the hub and the most strongly connected (red edges) to the other nodes, then resecting the SOZ node alone will result in a surgical response. In contrast, if the non-SOZ nodes are most strongly connected with each other (red edges), and weakly connected (blue edges) with the SOZ node, the patient will be a surgical failure if only the SOZ node is resected. (B) Illustration of the HFO subtypes detected using the topographical analysis method. Each panel includes the iEEG trace (above), the 80–600 Hz band-pass filtered iEEG (middle), and the corresponding contour lines of isopower in the time-frequency spectrogram (below). Each contour line is shown in blue, groups of closed-loop contours are in green, open-loop contours are in dark red. Note that sharp-spikes produce HFOs after band-pass filtering but no closed-loop contours.

