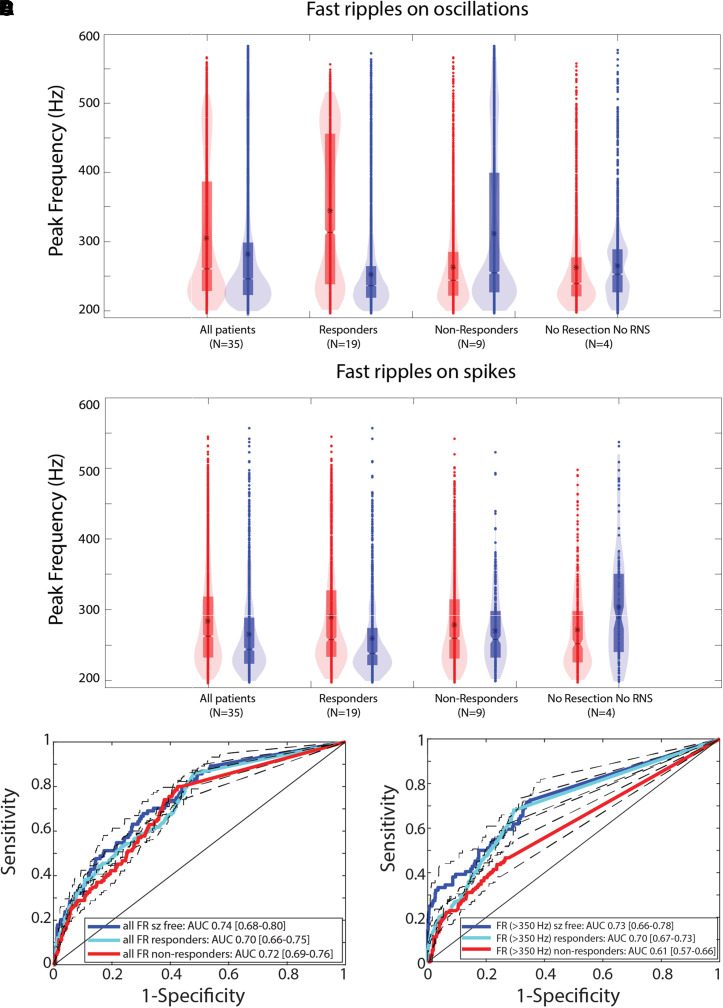
Figure 3.
Fast Ripples (FR) with a higher spectral content are better markers of epileptogenic brain regions. Violin plots of FR on oscillation (fRonO, A) and FR on spike (fRonS, B) peak spectral frequency in the SOZ (red) and non-SOZ (blue) in all patients, responders, non-responders and patients not offered resection or RNS. Asterisk indicates mean. In the responders, the peak spectral frequency of fRonO was higher in the SOZ than in the non-SOZ (GLMM, P < 1 × 10⁻⁵). In the non-responders, the peak spectral frequency of fRonO was lower in the SOZ than the non-SOZ (GLMM, P < 1 × 10⁻⁵). In the no resection/RNS group, fRonS peak spectral frequency was significantly higher in the non-SOZ (GLMM, P < 1 × 10⁻⁵). (C, D) ROC curves for seizure onset zone classification using the rate of all fast ripples, including fRonO and fRonS irrespective of frequency (C), and higher-frequency fast ripples (D, fRonO and fRonS > 350 Hz) for the different patient cohorts. The area under the ROC curve of FR (>350 Hz) rates was significantly different in responders compared with non-responders (bootstrapping, P < 0.05). Dashed lines and brackets indicate 95% CIs calculated using bootstrapping (n = 1000 surrogates).

