Figure 5.
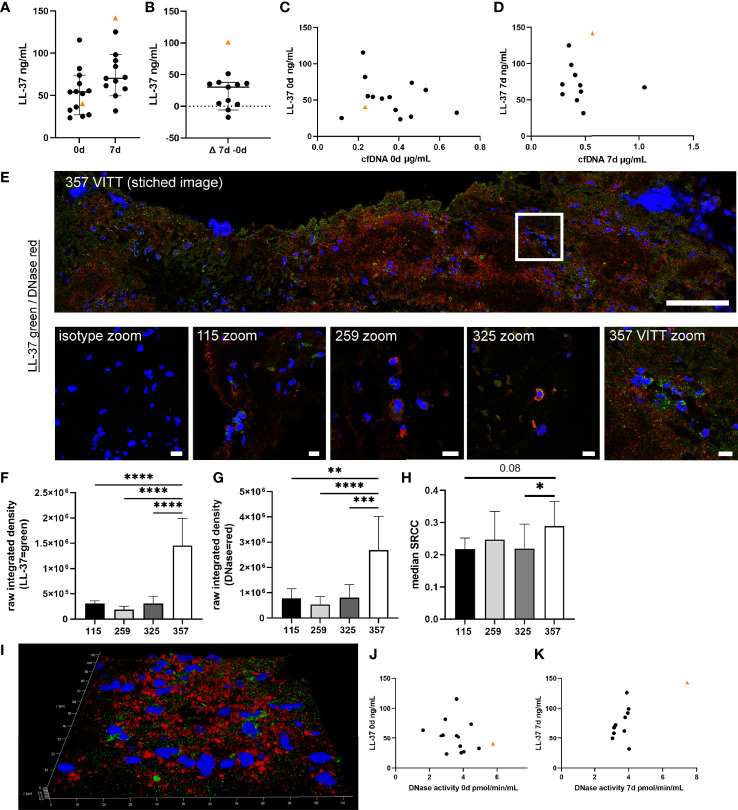
Cationic antimicrobial peptide LL-37, as potential protector of NETs against DNase degradation, is highly increased in VITT-samples. (A, B) LL-37, known to induce as well as bind to NETs and stabilize NETs against DNase degradation, was analyzed in EDTA plasma. All data are presented as scatter plots, black lines depict the median and whiskers depict 95% confidence intervals of control values. The VITT-patient is marked as orange triangle. The highest increase of LL-37 over time is detected in the VITT-patient (B). (C) Values of cfDNA and LL-37 at onset were plotted in one graph. (D) Values of cfDNA and LL-37 at 7d were plotted in one graph. (E) LL-37 (green) and DNase (red) were stained in extracted thrombi of the VITT-patient (357) and three control patients without VITT (115, 259 and 325). Stitched image shows distribution of both markers inside the thrombus of the VITT-patient (scale bar = 100µm). A zoom picture of the white squared area is presented. Microscope settings were adjusted to the presented isotype control and example pictures are presented, scale bar = 10µm. (F, G) The raw integrated density of LL-37 and DNase was measured in randomly selected pictures. Strong LL-37 and DNase signals in the same area were especially identified in the thrombus of the VITT-patient. All data are presented as mean ± SD. Statistical differences were analyzed by one-way ANOVA, followed by Tukey’s multiple comparisons test (**p < 0.01, ***p < 0.001 and ****p < 0.0001) (H) All single images analyzed in (F, G) were investigated for colocalization by calculating SRCC. Statistical differences were analyzed by unpaired on-tailed Student’s t-test (*p < 0.05) (I) 3D image of z-stacks (42 sections, 0.13µm steps, total size 5.16µm) from VITT-thrombus was constructed with LAS X 3D Version 3.1.0 software (Leica), scale bar = 10µm. In this area high amounts of obviously extracellular DNase and LL-37 were detected. (J) Values of DNase activity and LL-37 at onset were plotted in one graph. (D) Values of DNase activity and LL-37 at 7d were plotted in one graph.

