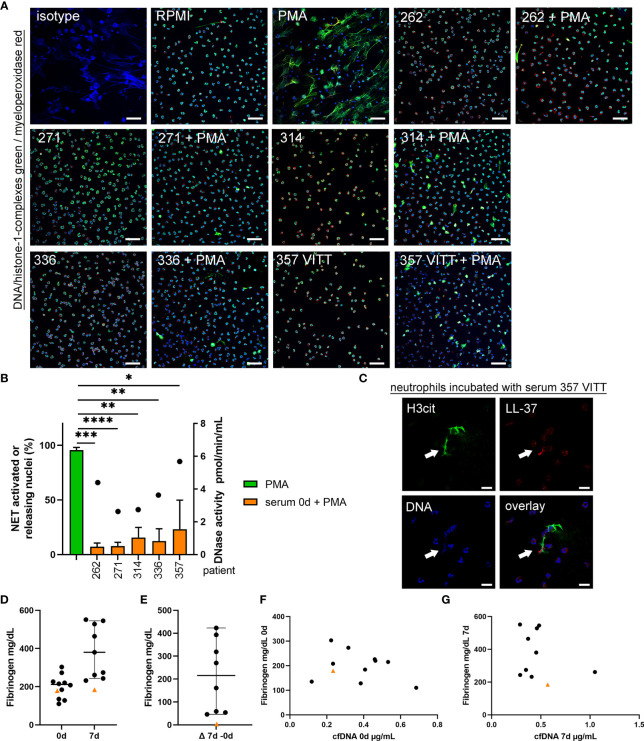
Figure 6.
Serum from VITT and control patients does not induce NET-formation, but NET-release from activated neutrophils is less inhibited in VITT-patient. (A) Human blood-derived neutrophils were incubated with serum from onset of four control patients and the VITT-patient in presence and absence of the ROS-dependent NET inducer PMA. Samples were analyzed for NETs (blue = DNA, green = DNA-histone-1-complex, red = myeloperoxidase) by confocal immunofluorescence microscopy. The settings were adjusted to a respective isotype control. Representative images (overlay) of all samples incubated with serum, a negative control (RPMI) and a positive control (PMA) are presented. Scale bar = 50µm. (B) In each experiment (n = 3) and for each sample, six randomly taken pictures from two individual slides were analyzed for NET quantification. All cells on the six pictures were counted and the mean of activated cells per experiment was calculated and used for statistic. Serum samples without PMA stimulation did not induce NETs (See Supplementary data Figure S3 ). In all serum samples the ROS-dependent NET-induction was significantly reduced. Highest NET-release was detected in the VITT-patient. Data were analyzed with one-tailed paired Student’s t-Test calculated always to PMA positive control (presented with mean ± SD (*p ≤ 0.05, **p < 0.01, ***p < 0.001 and ****p < 0.0001). The DNase activity in the analyzed serum samples, as potential NET degrading enzyme, is presented as dot referring to the right y-axis. (C) A representative image is presented, showing an extracellular DNA-fiber positive for citrullinated histone (H3cit) (green) and LL-37 (red) after incubation of neutrophils in serum from the VITT-patient (Scale bar = 20 µm). (D, E) Fibrinogen is described to inhibit NET release and was analyzed in citrate plasma. All data are presented as scatter plots, black lines depict the median and whiskers depict 95% confidence intervals of control values (n = 10). Each dot represents one patient. The VITT-patient is marked as orange triangle. A low value is detected in the VITT-patient, without almost no change (delta) over time (E). (F) Values of cfDNA and fibrinogen at onset were plotted in one graph. (G) Values of cfDNA and fibrinogen at 7d were plotted in one graph.

