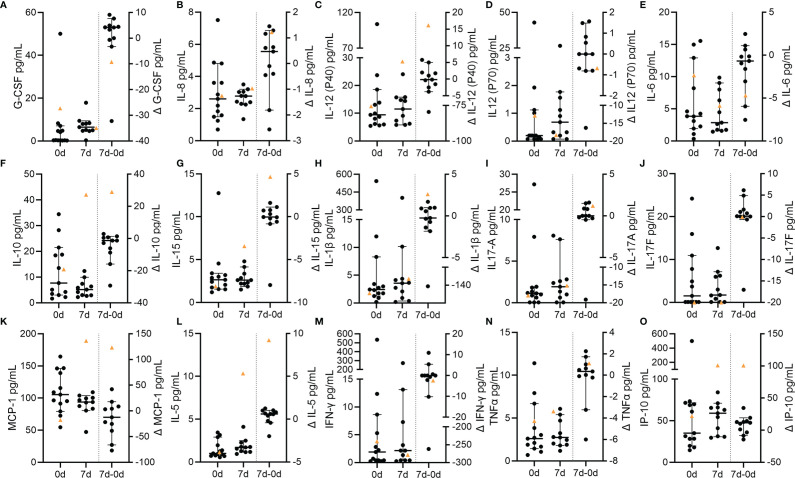
Figure 7.
Circulating cytokines in VITT and control stroke patients. Concentrations of circulating cytokines at baseline and at follow-up as well as the temporal differences (Δ) between both time points. Individual data of each patient and the corresponding median and 95% confidence intervals of control values are depicted with data points of the VITT-patient highlighted as orange triangle. (A) C-CSF; (B) IL-8; (C) IL-12 (p40); (D) IL-12 (p70); (E) IL-6; (F) IL-10; (G) IL-15; (H) IL-1β; (I) IL-17A; (J) IL-17F; (K) MCP-1; (L) IL-5; (M) INF-γ; (N) TNF-α; (O) IP-10.

