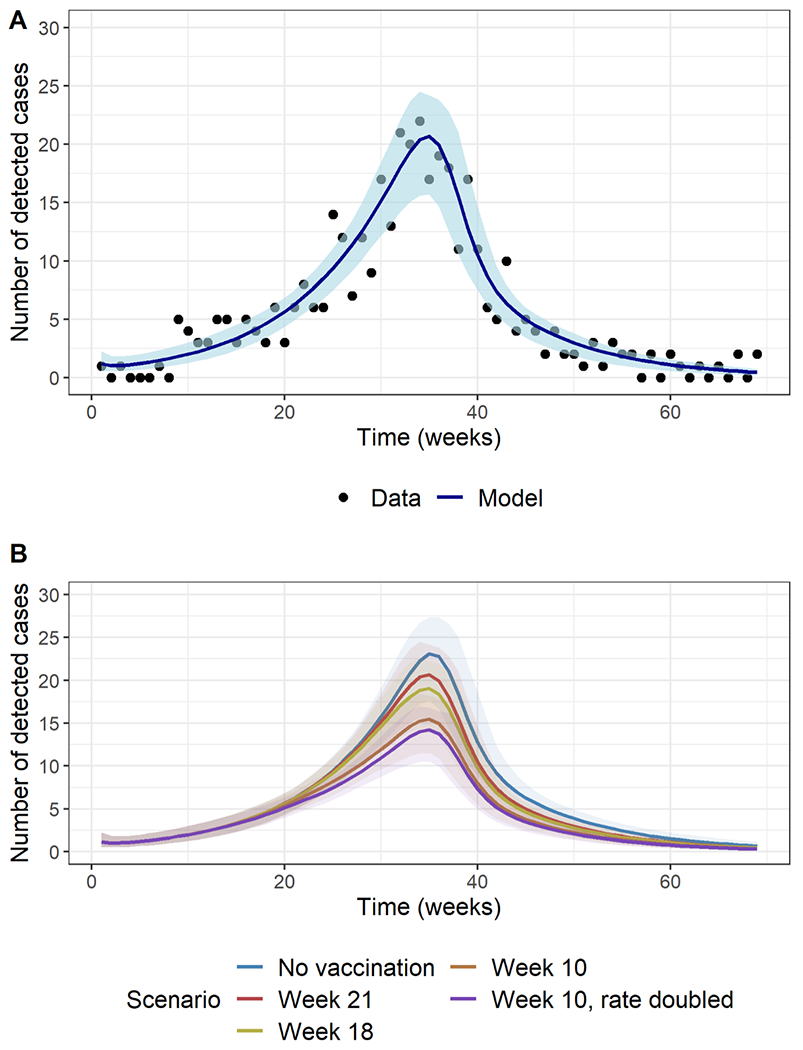
Figure 3:

A) Model fit (blue line) to weekly case counts of detected cases of hepatitis A among persons experiencing homelessness or who use drugs in Louisville (black dots). Shaded area is the 95% confidence region for the model estimates. B) Model estimates for the weekly number of detected cases under the various vaccination scenarios: no vaccination (blue line), vaccination initiation in week 21 as observed (reddish brown line), week 18 (green line), and week 10 with the observed coverage (brown line) and double the observed coverage (magenta line). 95% confidence regions for all scenarios are shaded in corresponding colors.
