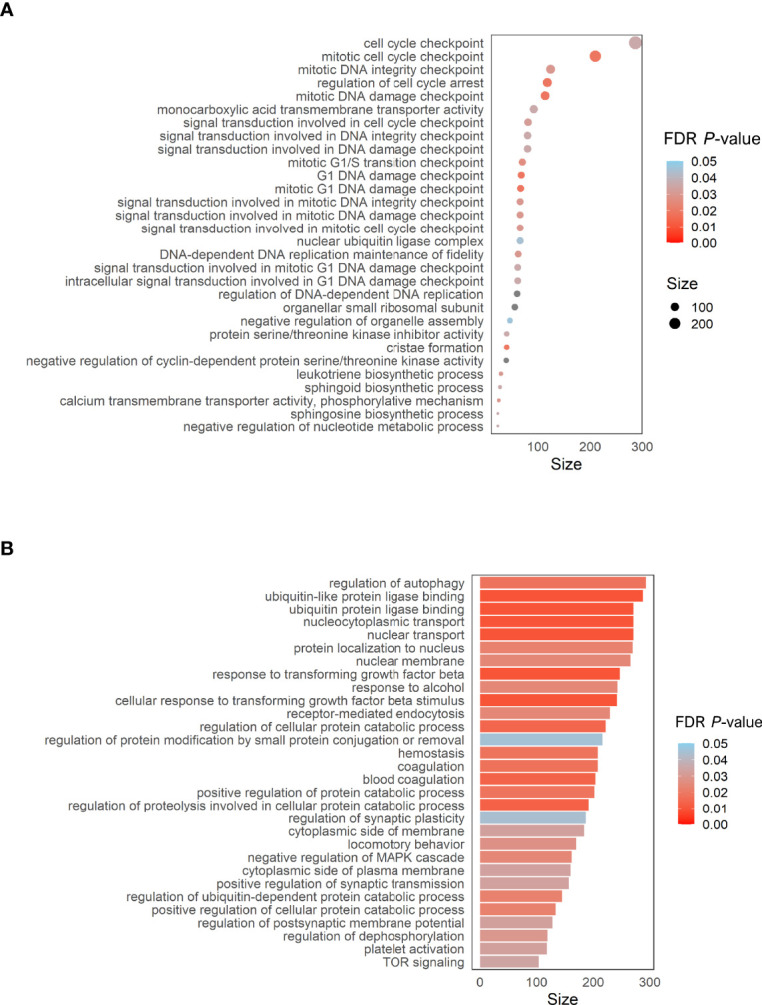
Figure 5.

(A) Dot plot of the top GO pathways (FDR P-value < 0.05) obtained between RW/AS-RSV and CR-RSV (methylglm approach). (B) Bar plot of the enrichment pathways analysis performed considering only CpGs within the promoter regions (methylRRA approach). Size along the x-axis indicates the number of genes involved in each pathway. Colors correspond to the different FDR P-values associated with the pathways.
