Figure 2.
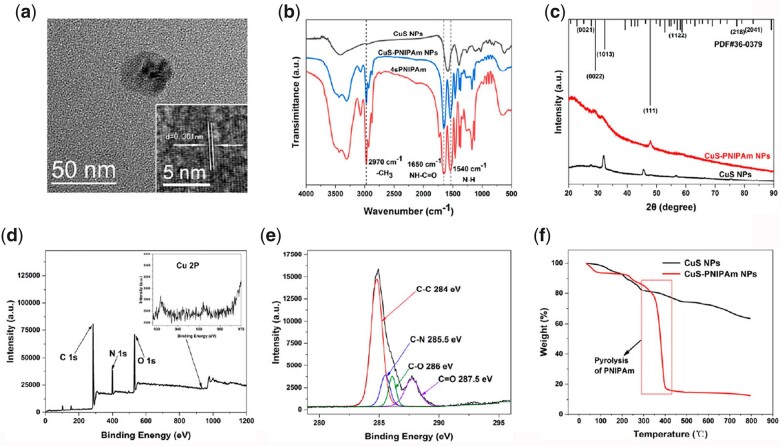
Characterization of CuS-PNIPAm NPs. (a) TEM image and high-resolution TEM image (inside). (b) FTIR spectra of CuS NPs, PNIPAm and CuS-PNIPAm NPs. (c) XRD spectra of CuS NPs and CuS-PNIPAm NPs. (d) XPS survey scan and (e) C 1 s spectrum of CuS-PNIPAm NPs. (f) TGA curves of CuS NPs and CuS-PNIPAm NPs.

