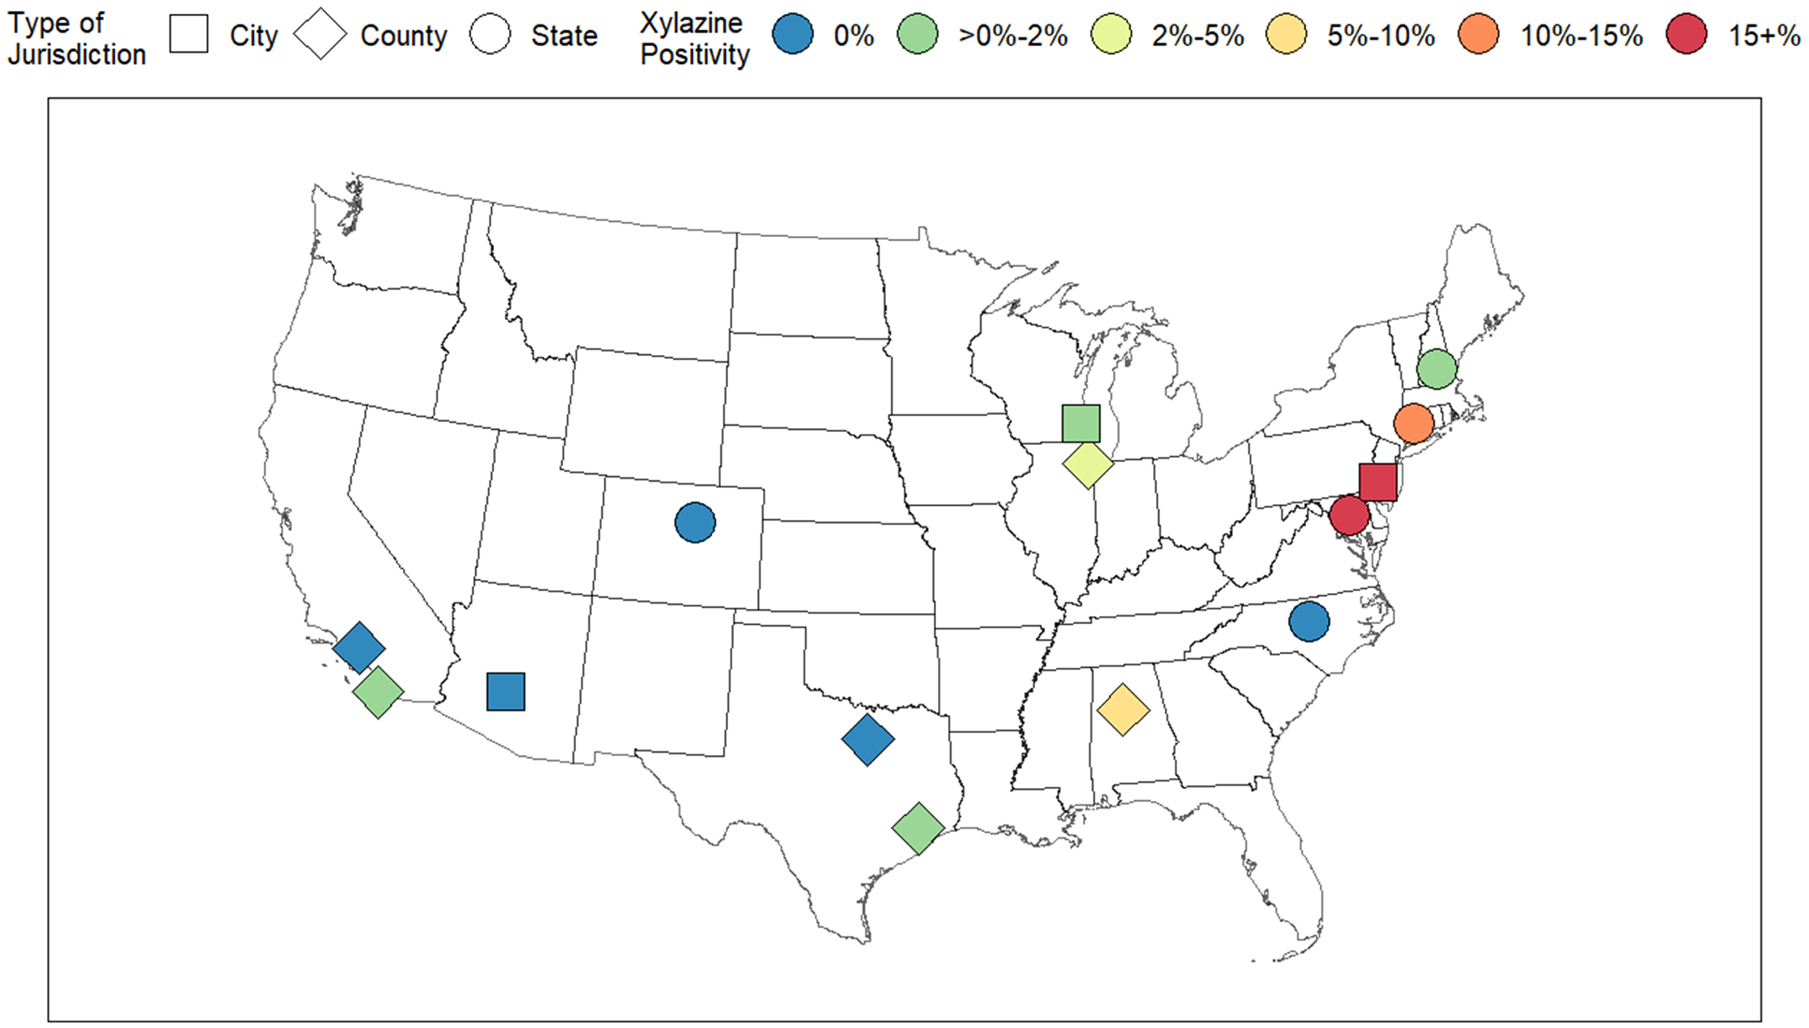
Fig. 2.

Geographic Distribution of Xylazine Positivity in Overdose Deaths. This figure summarizes the geographic distribution of xylazine positivity in overdose deaths in the full database of 14 locations. Point shape corresponds to type of jurisdiction. Color corresponds to the magnitude of xylazine positivity in the most recent year of data available for each location. Values for 2021 represent estimates, should trends from the observed fraction of the year continue linearly. The time period shown in each point can be seen in Supplemental Table 1.
