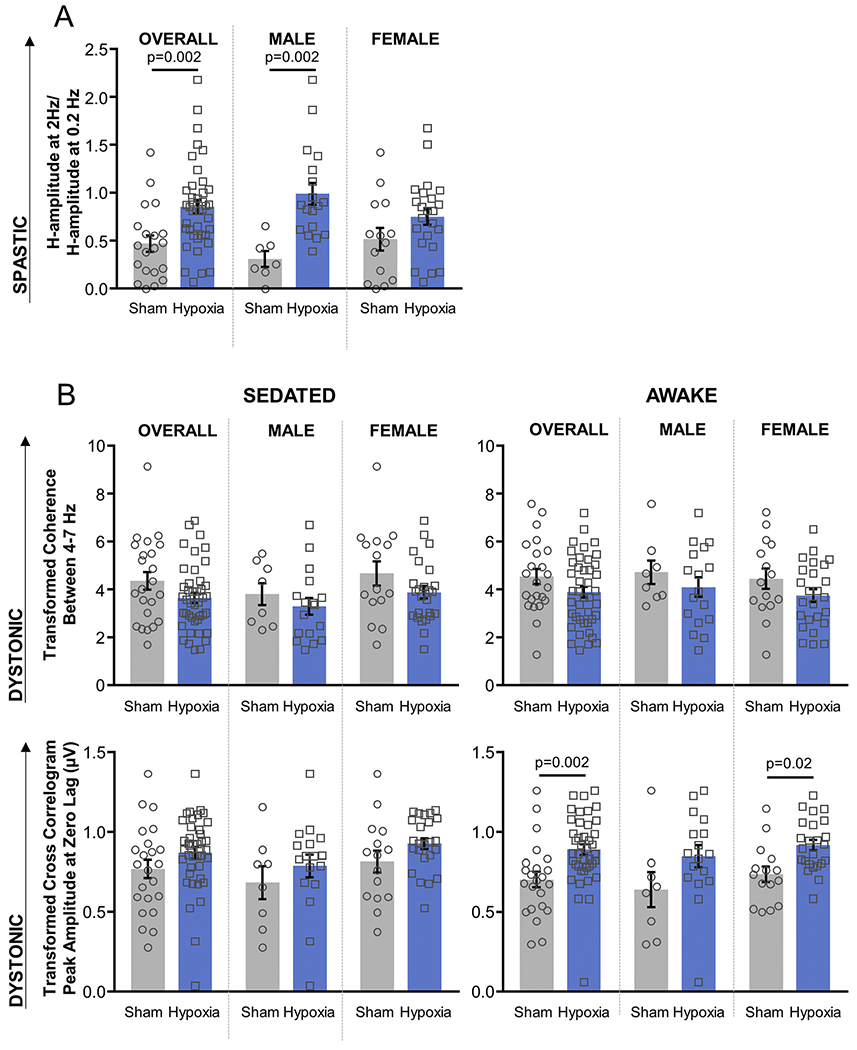
Fig. 3.

Electrophysiologic motor measures. A) H-reflex suppression (spasticity analogue, Fig. 1B); B) Transformed coherence between 4 and 7 Hz and transformed cross-correlogram amplitude at zero lag (dystonia analogues, Fig. 1C). EMG signals have been rectified and leveled to remove amplitude information. Cross-correlogram and coherence distributions have been normalized using the Fisher z-transform. P-values < .05 indicated (MANOVA with post-hoc Tukey HSD, Table 1).
