. 2020 Apr 2;10(23):13552. doi: 10.1039/d0ra90029j

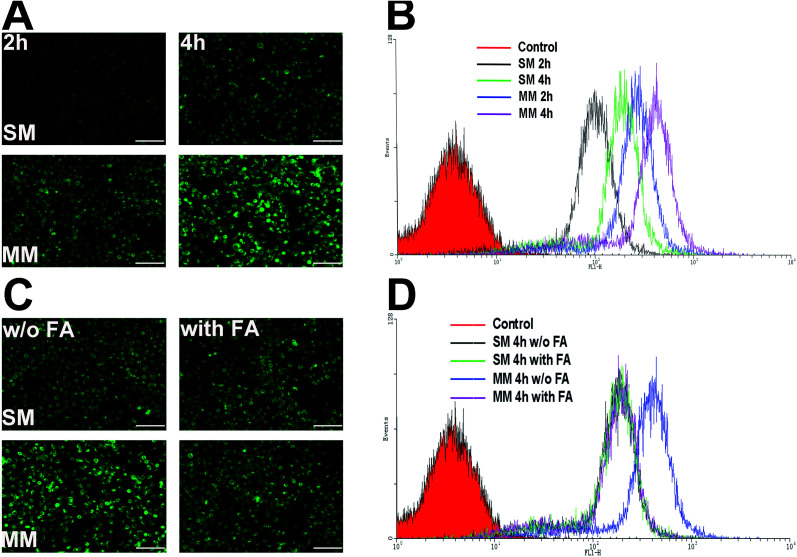
Fig. 4. The in vitro cellular uptake analysis of SMs and MMs in the Hela cells. (A) The inverted fluorescence microscope images of the cells incubated with the C6-loaded SMs and MMs for 2 and 4 h. Scale bar: 200 μm. (B) Flow cytometric analysis of mean fluorescence intensity in the cells treated with the C6-loaded SMs and MMs for 2 and 4 h. (C) Inverted fluorescence microscope images of the cells incubated with the C6-loaded SMs and MMs with or without the FA pretreatment 4 h. Scale bar: 200 μm. The data are shown as mean ± S.D. (n = 3). (D) Flow cytometric analysis of mean fluorescence intensity in the cells treated with the C6-loaded SMs and MMs with or without the FA pretreatment 4 h.

Fig. 4