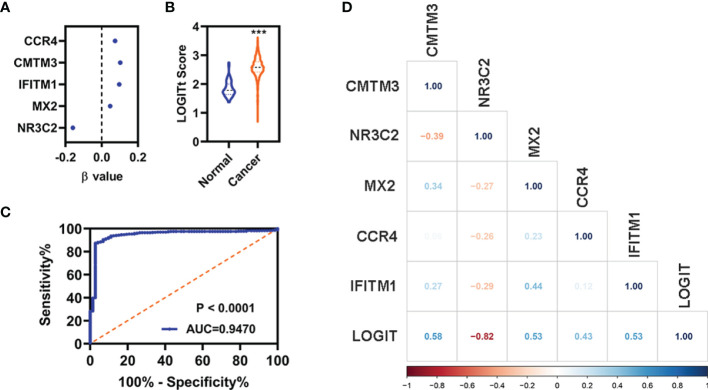
Figure 8.
Diagnosis model for distinguishing KIRC from normal in entire cohort. (A) The β value of these five FI-DEGs analyses by stepwise logistic regression. (B) Diagnosis LOGIT values between normal and patients with KIRC. (C) ROC curves for evaluating the predictive performance of the diagnostic model. (D) Correlation analyses for the expression of these five FI-DEGs and diagnostic model. N (normal) = 72, N (cancer) = 530. ***p < 0.001.

