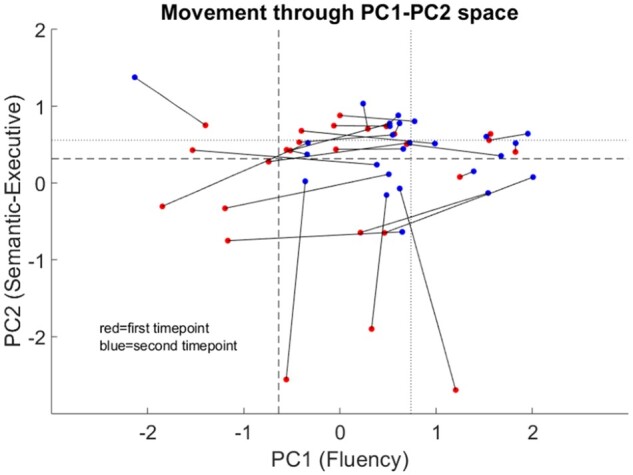
Figure 2.

Movement through PCA space during recovery. Scatter plot depicting the 26 patients with post-stroke aphasia moving through PC1–PC2 space between 2 weeks and 4 months post-stroke. Each line represents an individual patient with the red circle their time point 1 performance (2 weeks post-stroke) and the blue circle their time point 2 performance (4 months post-stroke). Dashed lines represent the ‘lower bound of normal control performance’; dotted lines represent the ‘mean PC score’; x- and y-axes show the component scores. PC1 = ‘fluency’ principal component; PC2 = ‘semantic/executive’ principal component.
