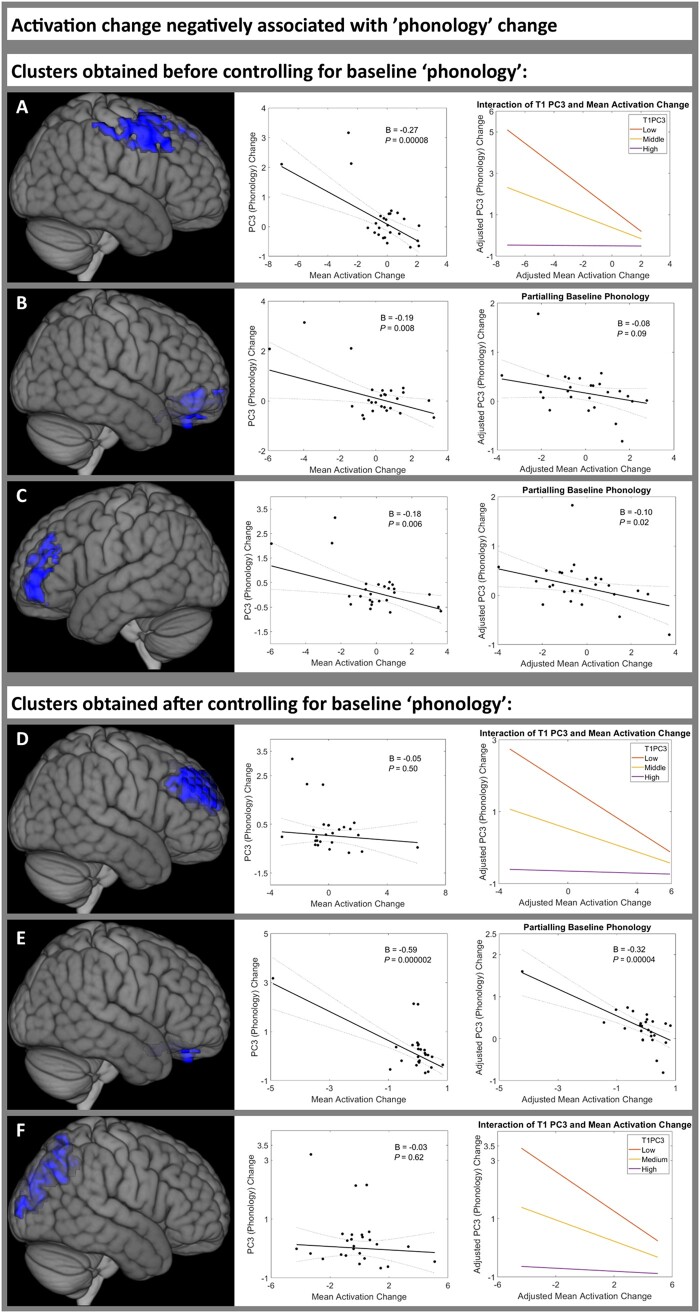
Figure 6.
Regions in which increased activation was negatively associated with phonology improvement between 2 weeks and 4 months post-stroke. Activation change was negatively associated with PC3 ‘phonology’ score change between time point 1 (2 weeks) and time point 2 (4 months post-stroke) in patients with post-stroke aphasia. Three clusters were significant before controlling for baseline ‘phonology’ score (A–C) (Supplementary Tables 18 and 19), three clusters were significant after controlling for baseline ‘phonology’ score (D–F) (Supplementary Tables 20 and 21). Left: Each cluster rendered on the MNI standard brain template. Middle: The association between the mean activation change of each cluster and PC3 ‘phonology’ score change, using robust regression. For clusters B, C and E, the right column shows the association between the mean activation change of each cluster and PC3 ‘phonology’ score change, controlling for baseline ‘phonology’ score, using robust regression. For clusters A, D and F, the right column shows the interaction plot for the adjusted association between the mean activation change of each cluster and PC3 ‘phonology’ score change, with baseline ‘phonology’ score fixed at high, middle and low values, using robust regression. Statistical thresholding used a voxel-wise cluster forming threshold of P < 0.005 (uncorrected) and a cluster-level threshold of P < 0.05 after familywise error correction. B = unstandardized regression coefficient; PC3 = ‘phonology’ principal component; T1 = time point 1 (2 weeks post-stroke); T2 = time point 2 (4 months post-stroke).

