Figure 2.
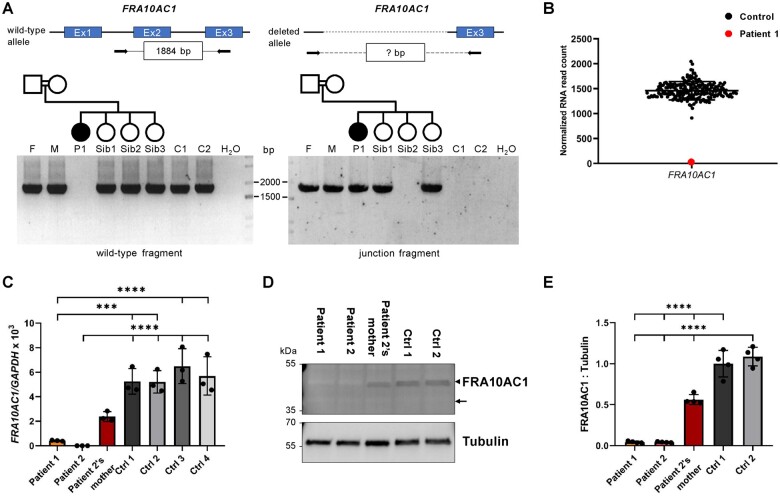
Biallelic FRA10AC1 loss-of-function variants in Patients 1 and 2. (A) FRA10AC1 junction PCR with DNA samples from Family 1. To validate the presence of the deletion of FRA10AC1 exons 1 and 2 in Family 1, we designed primers to amplify a FRA10AC1 wild-type fragment of 1884 bp (top left) and a deletion-spanning fragment of unknown size (question mark in the box in the top right panel). The wild-type fragment was not generated in Patient 1, but in her parents, the three healthy siblings, and two control individuals (bottom left). A junction fragment of ∼1900 bp amplified from Patient 1-derived DNA confirmed the FRA10AC1 deletion to be present in the homozygous state (bottom right). Amplification of both wild-type and junction fragment in the parents and siblings 1 and 3 indicate the FRA10AC1 deletion to be present in the heterozygous state (cf. bottom left and right panel). C1 and C2 = controls; F = father of Patient 1; M = mother of Patient 1; P1 = Patient 1; Sib1-Sib3 = healthy siblings of Patient 1. (B) Relative FRA10AC1 mRNA expression in fibroblasts of Patient 1. Transcriptome sequencing was performed with cDNA derived from 42 fibroblast cell lines including Patient 1 cells. The plot shows normalized FRA10AC1 RNA read count in the transcriptome data of the 42 fibroblast cell lines and included expression data of 171 fibroblast samples from the GTEx database. The red data-point represents FRA10AC1 read counts in Patient 1, while the black data-points represent those of the 212 other cell lines. The mean ± SD normalized read count of 213 samples is shown. (C) Quantification of the relative FRA10AC1 transcript levels in fibroblasts of Patients 1 and 2, the mother of Patient 2, and four controls by a TaqMan gene expression assay. GAPDH mRNA was used as an internal control. Relative quantification was performed according to the ΔCT method, and results were expressed in the linear form using the formula 2−ΔΔCT and multiplied by a factor of 1000. The mean ± SD of three independent experiments is shown. Statistical significance between controls and each patient was calculated by one-way ANOVA followed by Bonferroni post hoc test. ***P ≤ 0.001; ****P ≤ 0.0001. Datasets of three independent TaqMan gene expression assays with technical duplicates are provided in Supplementary Fig. 4. Ctrl = control. (D) Immunoblot of lysates obtained from fibroblasts of Patient 1, Patient 2, mother of Patient 2, and two controls. The amount of FRA10AC1 protein was monitored with an anti-FRA10AC1 antibody. An anti-Tubulin antibody was used to demonstrate equal loading. The predicted molecular mass of FRA10AC1 is ∼38 kDa (indicated by an arrow), although endogenous FRA10AC1 revealed a molecular mass of ∼45 kDa (indicated by an arrowhead). (E) Intensities of fluorescence signals were quantified using the ChemiDoc imaging system. The mean ± SD of four independent experiments is shown. One-way ANOVA with Bonferroni correction was used for statistical analysis: ****P ≤ 0.0001. Uncropped blots that were used for quantification are provided in Supplementary Fig. 5.

