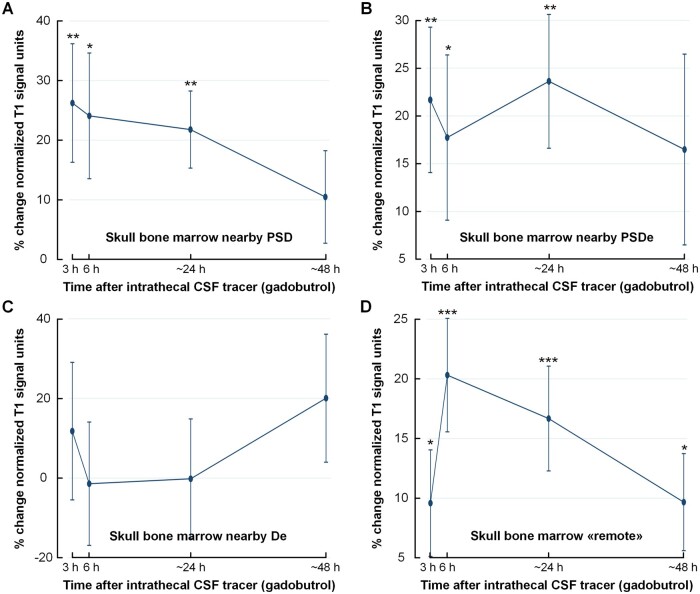
Figure 5.
Tracer enrichment within skull bone within different regions of interest. Tracer (gadobutrol) enrichment over time in different regions of skull bone marrow. (A) Skull bone marrow nearby PSD (n = 47). (B) Skull bone marrow nearby dural extensions from parasagittal dura (PSDe) to diploe (n = 27). (C) Skull bone marrow nearby dural extensions (De) to diploe in distance from the PSD (n = 12). (D) Skull bone marrow in distance from visible intradural tracer enrichment, denoted ‘remote’ (n = 47). The plots show the percentage change in normalized T1-BB signal units. The signal change, indicative of tracer enrichment, was highly significant for several locations (linear mixed model analysis; *P < 0.05, **P < 0.01, ***P < 0.001), with peak at 24 h. Trend plots presented by mean and error bars as standard errors.

