Figure 3.
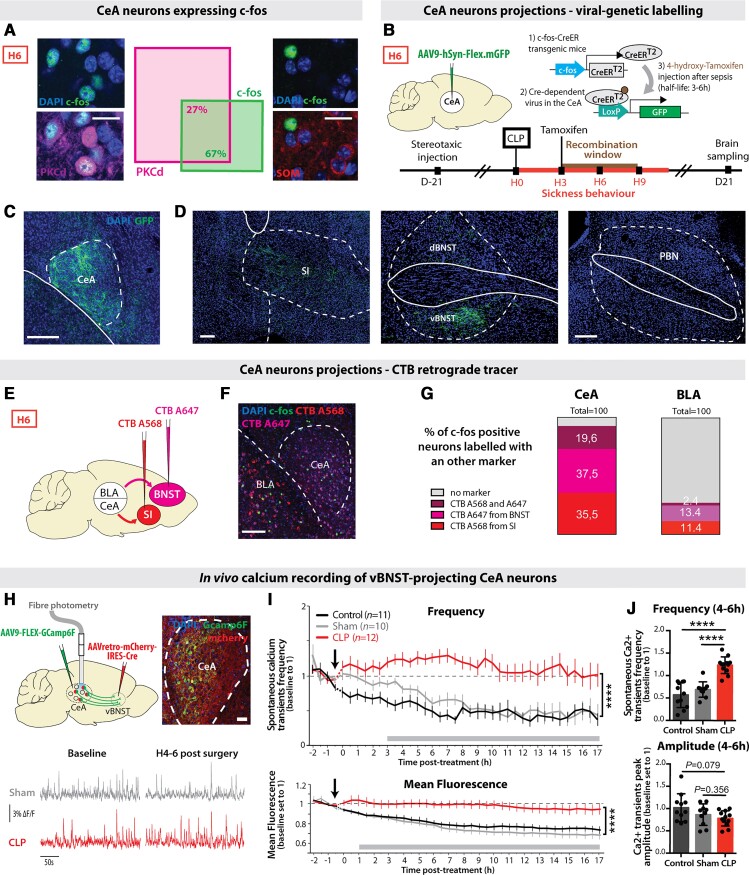
CLP triggered the activation of PKCδ+ CeA neurons projecting to the vBNST and the substantia innominata. (A) CeA c-fos+ neurons at H6 post-CLP were 67% co-localizing with PKCδ+ neurons, but 0% with SOM+ neurons (n = 6, total cell counted, nc-fos+/PKC = 301/453, ncfos+/SOM = 0/144; scale bar = 20 μm). (B–D) Viral trapping of CeA c-fos+ neurons at H6. (B) A Cre-dependent GPF+ AAV virus was injected in the CeA of transgenic mice expressing the tamoxifen-inducible Cre-recombinase enzyme under the control of the c-fos gene promoter. 4-Hydroxy-tamoxifen was injected into these mice 3 h after CLP for restricting the recombination window between H3 and H9 post-CLP. (C) Recombination site in the CeA. Scale bar = 200 μm. (D) GFP+ fibres only projected to the vBNST and the substantia innominata (SI) but not to other reported projection regions of CeA PKCδ+ neurons such as the PBN (n = 3, scale bar = 200 μm). (E–G) CTB retrograde tracing. (E) CTB A568 was injected in the substantia innominata and CTB A647 in the BNST. Mice underwent a CLP surgery 5 days after stereotaxic injection and were sacrificed at H6. (F) Representative picture of c-fos+ staining and CTB labelling. (G) C-fos+ neurons colocalized at 92.6% with retrograde CTB A568 and/or CTB A647 tracers in the CeA. In a control region such as the BLA, only 27.2% of the H6 c-fos+ neurons were co-localizing with both CTB tracers (n = 3, total cell counted, nc-fos = 173, scale bar = 200 μm). (H–J) In vivo calcium imaging of vBNST-projecting CeA neurons. (H) Gcamp6f-specific expression and recordings in the vBNST-projecting CeA neurons (scale bar = 50 μm) before and after surgery (CLP, red; sham, grey). (I) Spontaneous calcium events frequency (top) and mean fluorescence (bottom) in the vBNST-projecting CeA neurons were higher in CLP compared to control or sham mice [frequency: interaction: F(76,1075) = 2.268; group: F(2,1075) = 381.6, ****P < 0.0001; mean fluorescence: interaction: F(76,1107) = 1.602, P = 0.0011; group: F(2,1107) = 336.1, ****P < 0.0001]. (J) Between H4 and H6 (nControl = 11 nSham = 10, nCLP = 12), CLP mice (compared to control or sham animals) displayed a higher frequency of calcium events with a non-significant decrease in amplitude of those events. Statistics: (I) Two-way ANOVA and Sidak’s multiple comparison tests (grey bar when significant). (J) Mann–Whitney test or unpaired t-test, ****P < 0.0001. Data shown as mean ± SEM (I) and mean ± SD (J).

