Figure 5.
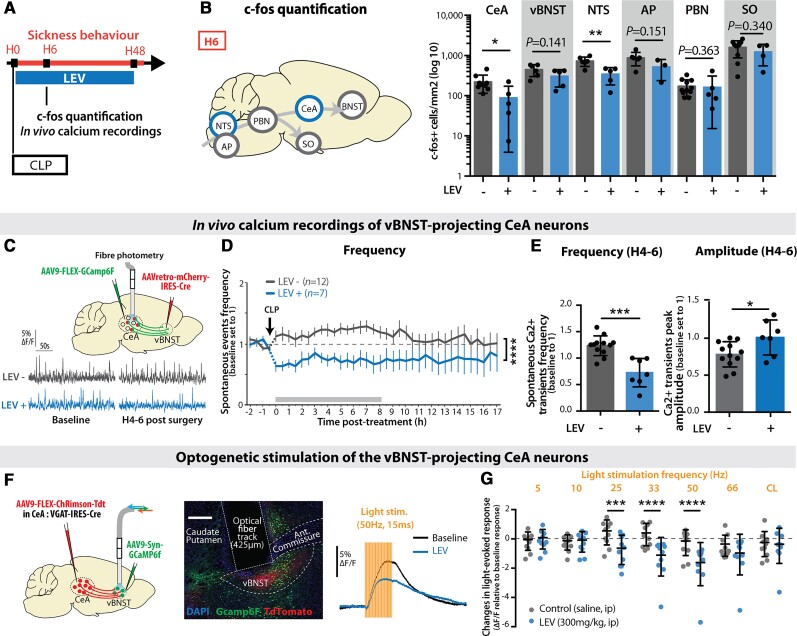
LEV administration during sepsis suppressed the transient neuronal activation in vBNST-projecting CeA neurons. (A) LEV was administrated every 12 h for 48 h post-CLP. (B) LEV treatment reduced the transient c-fos expression increase at H6 post-CLP only in the NTS and the CeA (CeA: nCLP = 9, nCLP+LEV = 5, *P = 0.0347, vBNST: nCLP = 6, nCLP+LEV = 5; NTS: nCLP = 6, nCLP+LEV = 5, **P = 0.0057; AP: nCLP = 6, nCLP+LEV = 3; PBN: nCLP = 11, nCLP+LEV = 5; supra-optic nucleus (SO): nCLP = 10, nCLP+LEV = 4). (C–E) In vivo calcium imaging of the vBNST-projecting CeA neurons. (C) Gcamp6f specific expression and in vivo recording in the vBNST-projecting CeA neurons before and hours after CLP, in absence or presence of LEV treatment. (D) LEV administration showed a direct inhibiting effect over the increased neuronal spontaneous activity observed in vivo post-CLP [group: F(1,616) = 141.7, ****P < 0.0001]. (E) Between H4 and H6 post-CLP (nCLP = 12, nCLP+LEV = 7), LEV treatment induced a decreased frequency and an increased amplitude of the calcium events compared to non-treated animals (frequency: ***P = 0.0001, amplitude: *P = 0.0265). (F and G) Optogenetic stimulation of axon terminals from ChRimsonR-expressing vBNST-projecting CeA neurons and recording of the light-evoked response in vBNST neurons. Scale bar = 200 μm. Thirty minutes following LEV intraperitoneal injection (blue), the light-evoked response (normalized to the baseline light-evoked response before injection) was decreased compared to saline injection (grey) [n per group = 10, interaction: F(6,54) = 5.472; frequency: F(6,54) = 5.472, ***P = 0.0002; group: F(1,9) = 3.412, P = 0.0978; Control-LEV: 25 Hz, ***P = 0.0009]. CL = continuous light. LEV data in B are pooled with CLP data from Fig. 2 and LEV data in D and E are pooled with CLP data from Fig. 3. Statistics: (B and E) Mann–Whitney test or unpaired t-test. (D and G) two-way ANOVA (repeated measure for G) and Sidak’s multiple comparison tests (grey bar when significant). ****P < 0.0001. Data shown as mean ± SD (except D ± SEM).

