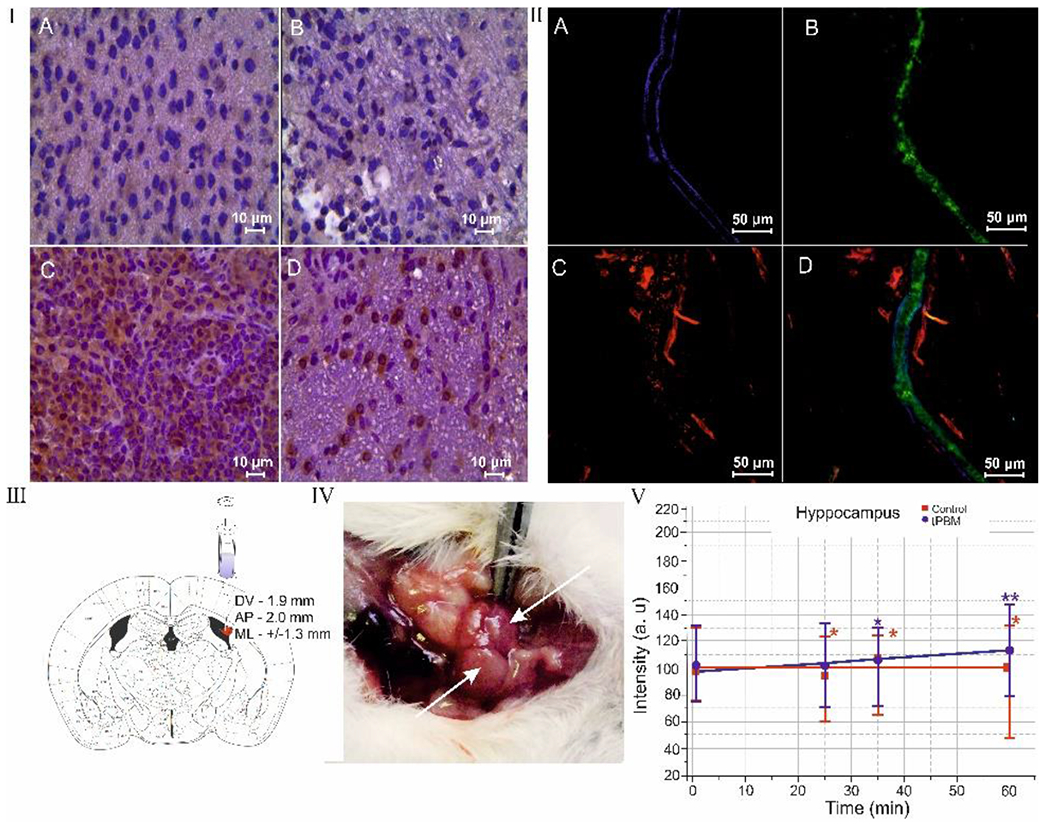
Fig. 1.

tPBM effects on distribution of Aβ deposition in the mouse brain and clearance of Aβ via MLVs: I – ICH imaging of Aβ depositions (brown color) in the brain tissues in the control group (a), in the sham-treated group (b), in the mice with AD (c) and in mice with AD after tPBM (d); II – the clearance of Aβ (green color) via MLVs (blue color): a – MLV labeled by LYVE-1; b – the precence of fluorecent Aβ in MLVs; c – the cerebral venous vessels (red color) labeled by CD31; d – the marged image from a,b,c; III – stereotaxic coordinates of intrahippocampal injection of Aβ(1-42) peptide in mice; IV - anatomical position of dcLNs on the neck of mouse; V - OCT data of rate of accumulation of GNRs in dcLNs in untreated mice (black line) and in mice received tPBM (red line) after GNRs injection into the hippocampus. * - p<0.05 vs. basal level; † - p<0.05 between groups. n=10 in each group.
