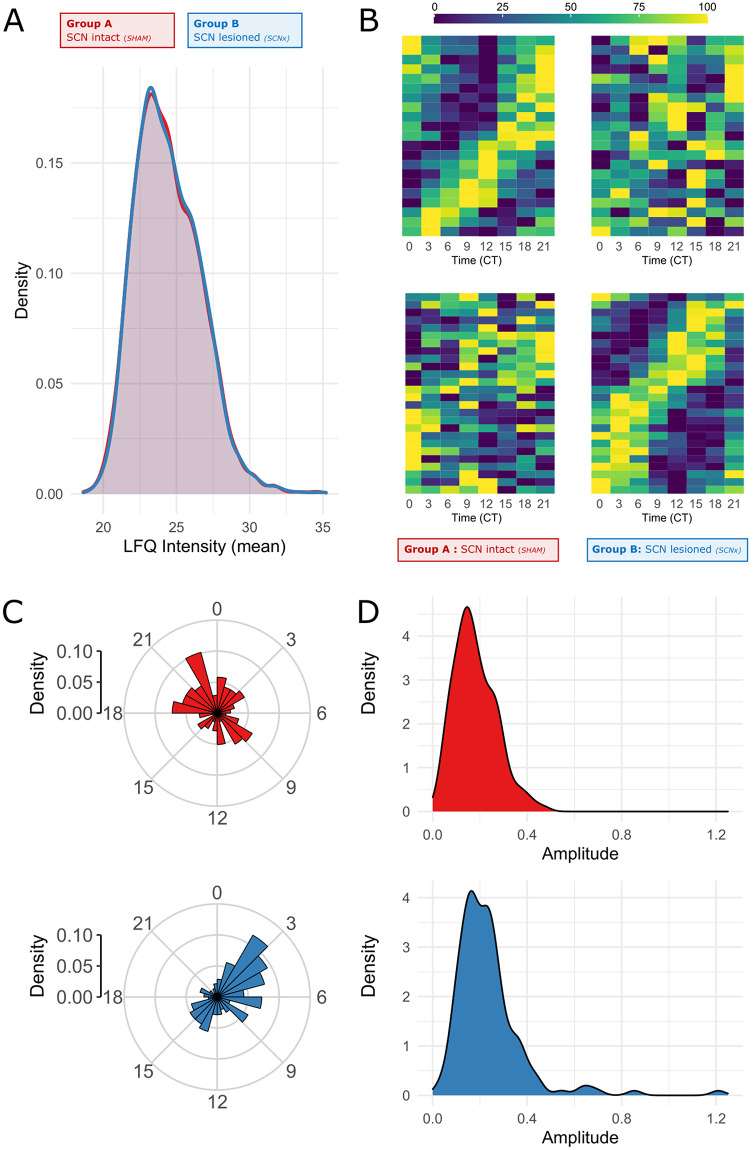
Fig 7. Proteomics.
LFQ intensity values of 3,707 unique proteins detected in Groups A (SHAM, ad libitum) and B (SCN-X, tRF) across 8 time points (CT0-CT21). (A) Density plot of mean LFQ values shows similar distribution in both groups (t test, P = 0.69) (B) Heatmaps of normalized protein levels in the fetal SCN for Groups A (left) and B (right) characterized as rhythmic via BioCycle (p < 0.05 in Group A [top] or Group B [bottom]). (C) Phase and (D) amplitude distribution of proteins rhythmic in Group A (red) and Group B (blue). For raw data, see S5 Data. LFQ, label-free quantification; SCN, suprachiasmatic nuclei.

