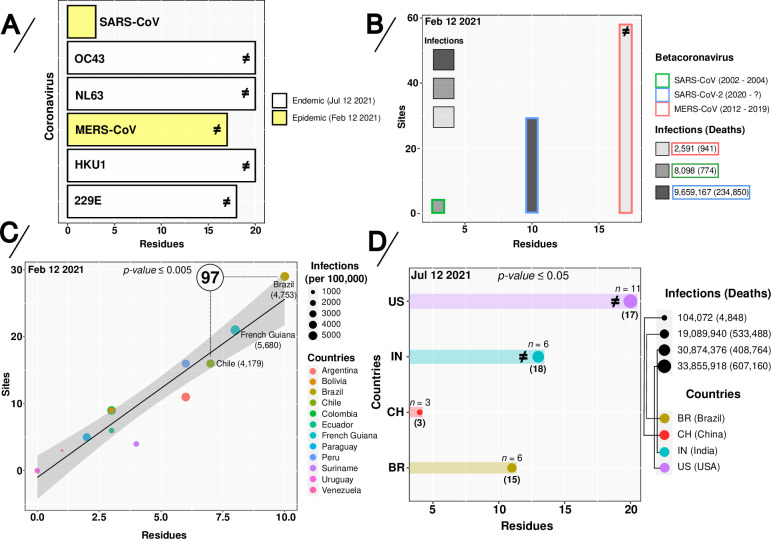
Fig 1. Directionally-evolving sites and residues in alpha- (229E and NL63) and beta- (OC43, HKU1, SARS-CoV, MERS-CoV and SARS-CoV-2) coronavirus sequences.
(A) Directed-evolving residues in six different endemic and epidemic human coronaviruses (HCoVs), (B) Sites and residues vs infections in epidemic and pandemic coronaviruses (CoVs). (C) Linear-regression curve and co-relationship on the absolute amount of sites and/or residues under directional-positive selection given SARS-CoV-2 infections per 100,000 people from South America countries and (D) the total number of SARS-CoV-2 infections in Brazil, China, India and the USA. In panels A, B and D, the symbol ≠ represents the presence of recombination breakpoints signals. In panel B, on the upper left, different intensities in grayscale are directly related to the number of infections. In panel C, the number inside the circle represents the amount of clusters found in Brazil and Chile. In panel D, n represents the amount of SARS-CoV-2 variants and the numbers in parentheses indicate sites under directional and convergent evolution in the Spike-encoding protein. P-values were obtained by considering the DEPS [sites and/or residues] vs infections per 100.000 inhabitants from one-way analysis of variance (ANOVA) and nonparametric methods, as described in the Statistical analysis section. Colors and symbols used in the panels are defined in the legend to the right of the figure.

