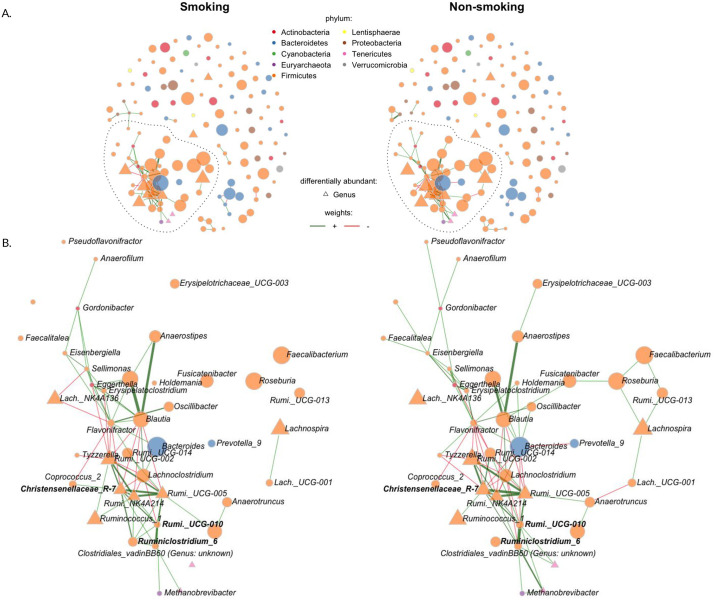
Fig 4. Genus-genus associations of smokers and never-smokers (n = 271, p = 140).
(A) Visualization of the genus-genus partial correlations estimated with the SPIEC-EASI method. Edges thickness is proportional to partial correlation, and color to sign: red: negative partial correlation, green: positive partial correlation. Node size is proportional to the centered log ratio of the genus abundances, and color is according to phyla. Triangle shaped nodes are differentially abundant (see Fig 3). (B) Zoom in largest connected component and differential associations (bold genera).

