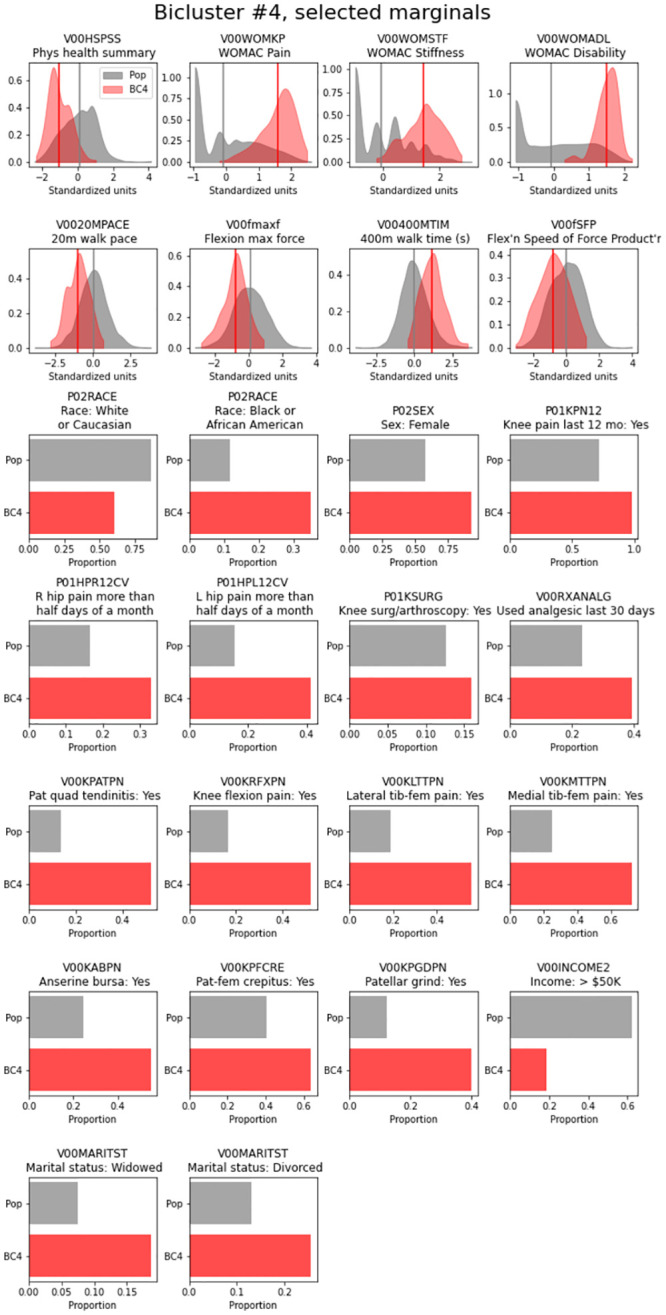
Fig 2. Distribution of top features for bicluster 4 (all knees).

Marginal plots of key features for bicluster 4 are shown, with the distribution for the overall cohort of knees in gray and the distribution of each feature in bicluster #4 shown in red; vertical lines indicate the mean value for each group.
