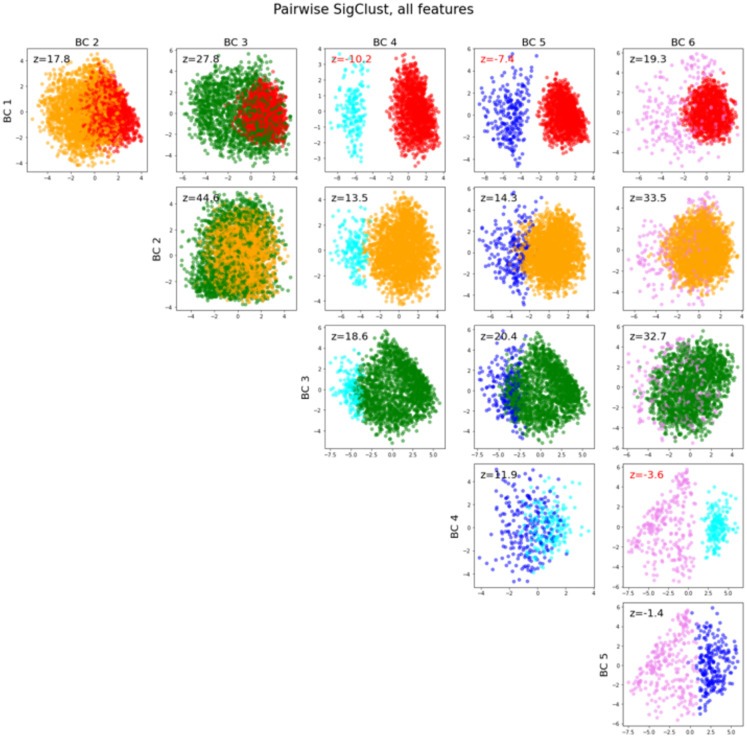
Fig 5. Pairwise SigClust among each pair of biclusters.
Each pair of biclusters is plotted in a two-dimensional scatterplot: the horizontal axis of each scatterplot is the mean-difference direction (the vector between the centers of the biclusters) and the vertical axis is the orthogonal principal component to the mean-difference direction. The SigClust z-score for the pair of biclusters is printed on the plot in black, and in red if it is below -2 (which would demonstrate statistical significance in the absence of multiple comparisons).

