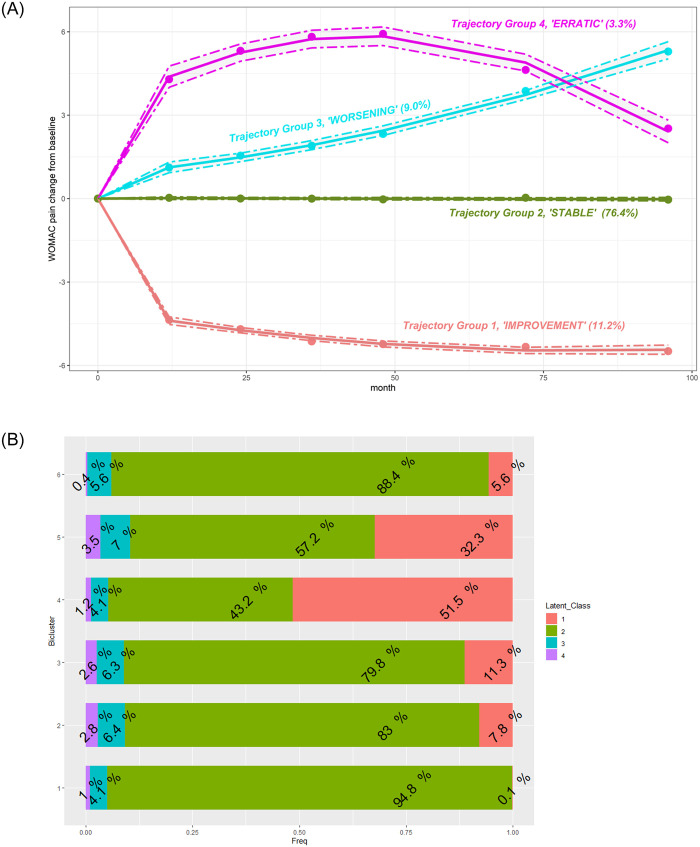
Fig 8.
A. Estimated trajectories of WOMAC pain change with 95% confidence intervals (dotted lines) defined by GBTM. Group 1 (red): 11.2% of knees with a mean probability of assignment of 0.94±0.12. Group 2 (green): 76.4% of knees with a mean probability of assignment of 0.95±0.10. Group 3 (cyan): 9.0% of knees with a mean probability of assignment of 0.83±0.16. Group 4 (pink): 3.3% of knees with a mean probability of assignment of 0.88±0.15. See also S1 Fig. B. Assignment to the trajectory by bicluster. Each horizontal bar represents a bicluster. The numbers within the segments of the bar are proportions of knees assigned to a specific trajectory.

