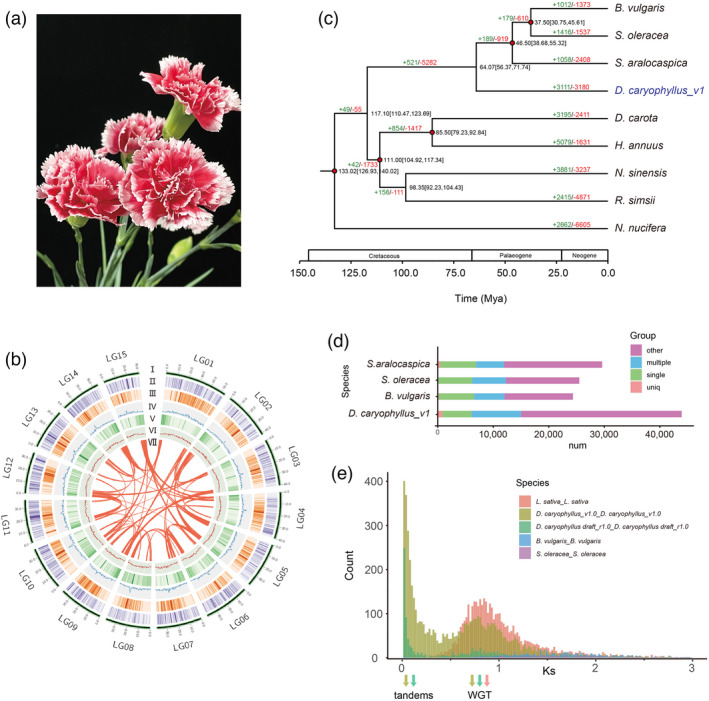
Figure 1.

Phylogenetic analysis of the D. caryophyllus genome. (a) Flower of D. caryophyllus ‘Scarlet Queen’. (b) Distribution of carnation genomic features. Circular representation of the 15 pseudochromosomes (I) chromosome length in Mb, (II) gene density, (III) the density of all LTRs, (IV) the density of all Gypsy‐LTRs, (V) the density of all Copia‐LTRs, (VI) GC content in 500 kb windows, and (Ⅶ) each linking line in the center of the circle connects a pair of homologous genes. (c) Phylogenetic tree for D. caryophyllus and eight other eudicot species. Gene family expansions are indicated in green, and contractions in red. The estimated divergence time (million years ago, MYA) is indicated at each node; numbers in brackets are the 95% confidence intervals (each center is defined as mean value). The red dot represents a calibration point. (d) Genes in different groups of D. caryophyllus_v1 and other sequenced genomes were shown and the values are shown with bar charts. (e) Ks values reveal a polyploidy event in carnation compared with S. oleracea and B. vulgaris which have not experienced recent polyploidy events and L. sativa which experienced a recent WGT event.
