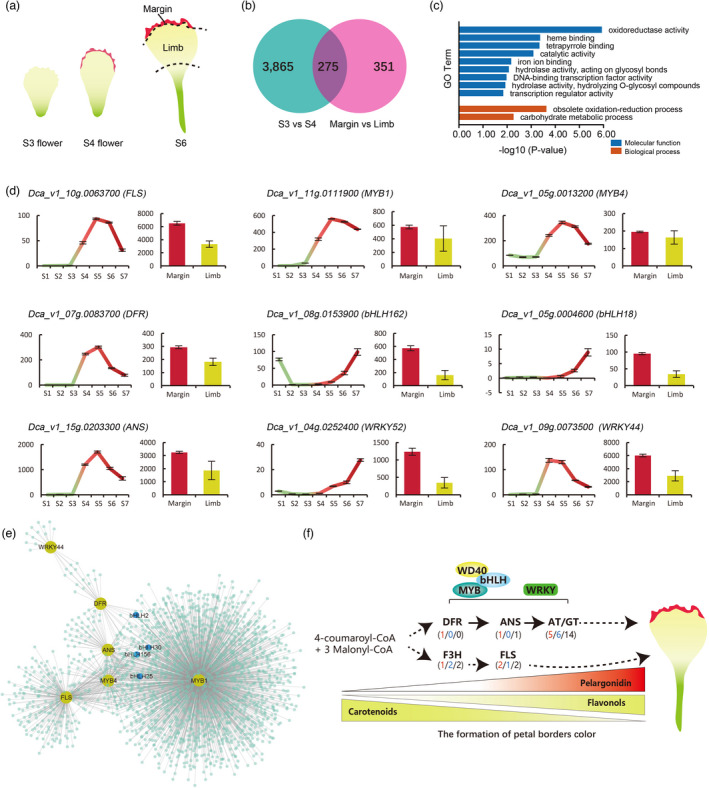
Figure 4.

The formation of petal margin coloration. (a) Flower petal (corolla lobe) morphology and coloration at different stages of development (b) Venn diagram indicates the number of DEGs in two comparisons. (c) Gene Ontology (GO) enrichment analysis of DEGs in two comparisons. (d) The expression of anthocyanin synthesis‐related genes in 7 stages and two tissues. (e) Sub‐network for Dca_v1_10g0111900_MYB, low values to small size circle. Low to high expression is indicated by a change in color from blue to red. (f) Proposed regulatory pathways for petals coloration.
