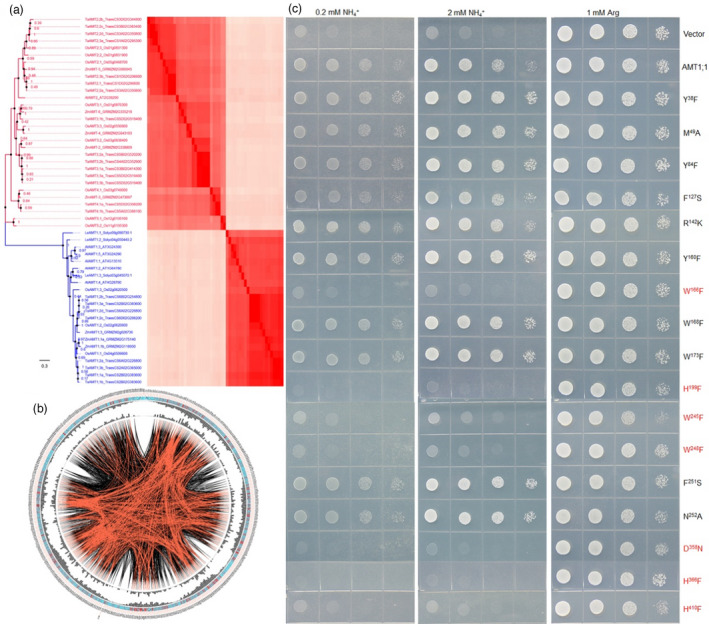
Figure 2.

Function of the conserved residue of AMTs. (a) Phylogenetic tree for AMTs was generated using MEGA 7.0. The percentage of replicate trees in which the associated taxa clustered together in the bootstrap test (1000 replicates) is shown next to the branches. Heat map representation of protein sequence identities of the AMTs analysed by ClustalW. (b) Network analysis of conserved and coevolving residues from plant AMTs. The circular network shows the connectivity of coevolving residues. The coloured square boxes in the circle indicate MSA position conservation (highly conserved positions are shown in red and less conserved positions in blue). The second and third circles show the proximity mutual information (MI) and cumulative MI (cMI) values as histograms facing inward and outward respectively. In the centre of the circle, the edges that connect pairs of positions represent significant MI values (>6.5), with red lines indicating the highest MI scores (top 5%), black lines indicating midrange scores (between 70 and 95%) and grey lines indicating the lowest scores (the remaining 70%) as defined by MISTIC. (c) Except for AMT1;1 mutants Y38F, M49A, Y84F, F127S, R142K, Y160F, W168F, W173F, F251S and N252A, other mutations (W166F, H199F, W245F, W248F, D358N, H366F and H410F) in AMT1;1 led to loss of NH4 + transport activity. Empty vector (pDRf1) and AMT1;1 were used as the negative and positive controls respectively.
