Figure 6.

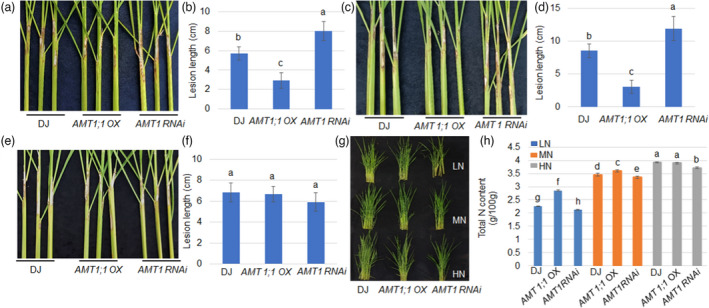
The effects of nitrogen fertilization level on AMT1;1‐mediated rice resistance to ShB. (a) Wild‐type (DJ), AMT1;1OX and AMT1RNAi plants cultured in LN supply condition (50 kg/ha) were inoculated with R. solani AG1‐IA for 14 d. (b) The lesion lengths shown in (a) were measured and statistically analysed. Data represent means ± standard error (SE) (n > 10). (c) Wild‐type (DJ), AMT1;1OX and AMT1RNAi plants cultured in LN supply condition (150 kg/ha) were inoculated with R. solani AG1‐IA for 14 d. (d) The lesion lengths shown in (c) were measured and statistically analysed. Data represent means ± standard error (SE) (n > 10). (e) Wild‐type (DJ), AMT1;1OX and AMT1RNAi plants cultured in HN supply condition (300 kg/ha) were inoculated with R. solani AG1‐IA for 14 d. (f) The lesion lengths shown in (C) were measured and statistically analysed. Data represent means ± standard error (SE) (n > 10). (g) Rice seedlings of wild‐type, AMT1;1 OX and AMT1RNAi plants grown under LN, MN and HN conditions for 14 days. (h) The total nitrogen from wild‐type, AMT1;1 OX and AMT1RNAi plants was determined by the Kjeldahl method. Data represent means ± standard error (SE) (n > 10). Significant differences at the P < 0.05 level are indicated by different letters.
