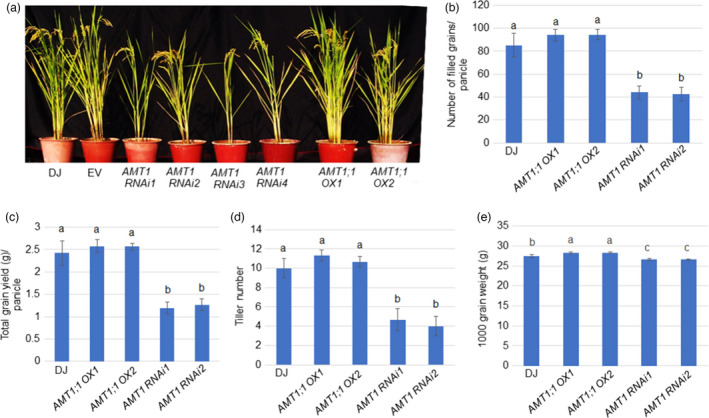
Figure 8.

Comparison of yield index between AMT1;1 OX, AMT1 RNAi and WT plants grown in LN condition. (a) Mature plant morphology, (b) tiller number, (c) filled grains per panicle, (d) total grain yield and (e) 1000 grain weight were calculated. Data are means ± SD of 12 plants. Significant differences at the P < 0.05 level are indicated by different letters.
