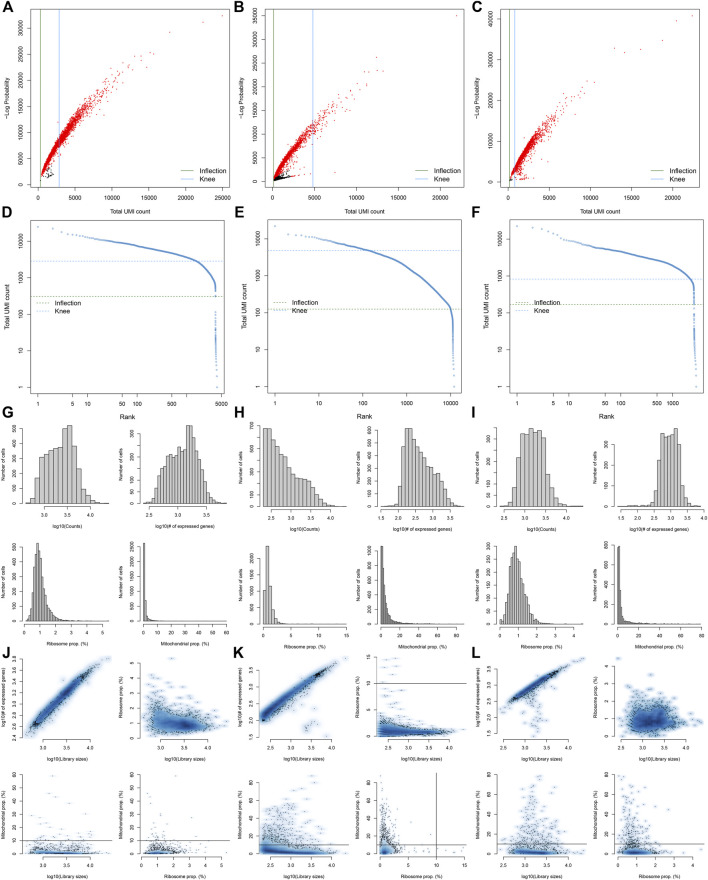
FIGURE 2.
Pre-processing, quality control, and normalization of scRNA-seq data of the diabetic kidney specimens. (A–C) The total count against the negative log-probability in the three diabetic kidney specimens. Red indicated cell droplet and black indicated empty droplet. (D–F) Barcode rank plots in the three diabetic kidney specimens. The inflection points of the knee indicate the transition of the total count distribution. (G–L) The ratios of mitochondrial and ribosomal genes expressed in each cell of the three diabetic kidney specimens.

