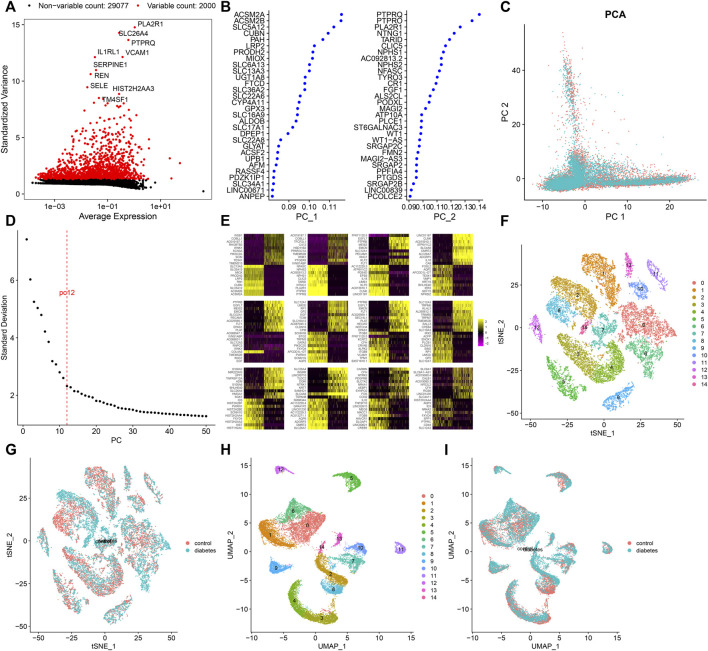
FIGURE 3.
Screening highly variable genes and cell clustering. (A) Screening the top 2,000 highly variable genes across cells based on scRNA-seq data. Red dots indicate the highly variable genes and black dots indicate no significant genes. (B) Contribution of genes in the first two PCs. (C) PCA of filtered cells from the diabetic kidney specimens (green dots) and controls (red dots). (D) Elbow plot for identifying the optimal PCs. (E) Heat map visualizing the expression of marker genes in each PC. Cell clustering based on the (F,G) t-SNE and (H,I) UMAP methods.

