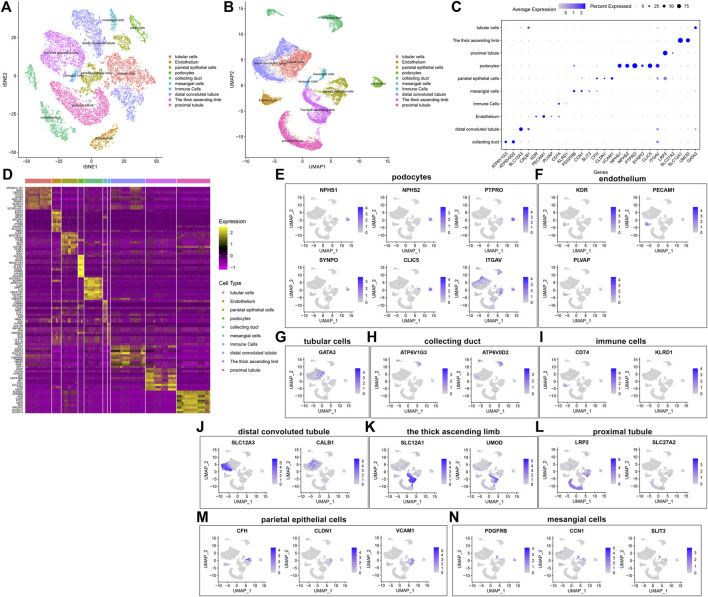
FIGURE 5.
Identification of cell types and their marker genes. (A,B) Identification of cell types in the diabetic kidney specimens and controls. Each cell type was marked by a unique color. (C) The expression patterns of marker genes among cell types (D) Heat map for the top ten marker genes in each cell type. The expression distribution of marker genes in (E) podocytes, (F) endothelium, (G) tubular cells; (H) collecting duct; (I) immune cells; (J) distal convoluted tubule; (K) the thick ascending limb; (L) proximal tubule; (M) parietal epithelial cells; and (N) mesangial cells.

