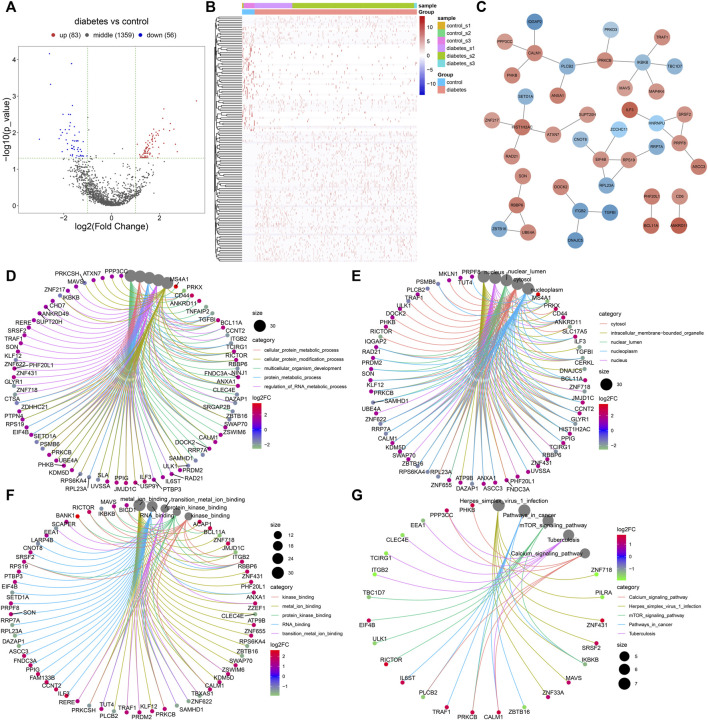
FIGURE 7.
Identification of differentially expressed marker genes of immune cells in diabetic nephropathy and analysis of their biological implications. (A) Volcano diagram showing the expression differences in marker genes of immune cells between the diabetic kidney specimens and controls. Blue: down-regulation; red: up-regulation and grey: no significance. (B) Hierarchical clustering analysis visualizing the expression patterns of differentially expressed marker genes of immune cells between diabetic kidney specimens and controls. Blue indicates down-regulation and red indicates up-regulation. (C) The PPI network based on the differentially expressed marker genes of immune cells. The depth of the color of bubble was proportional to |log2fold-change|. Blue indicated down-regulation and red indicated up-regulation. (D) Biological processes, (E) cellular components, (F) molecular functions, and (G) KEGG pathways enriched by the differentially expressed marker genes of immune cells. The size of the bubble was proportional to the number of enriched genes.

