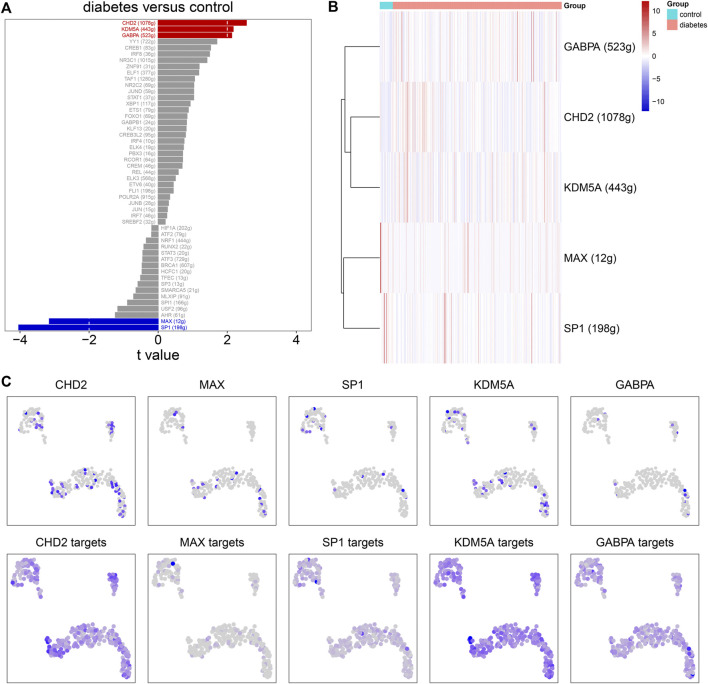
FIGURE 8.
Single-cell regulatory network analysis. (A) The top 50 transcription factors according to the t values by comparing AUC values between diabetic nephropathy and controls. (B) Heat map for the AUC values of the main transcription factors in diabetic kidney specimens compared to controls. (C) The expression levels (upper) and AUC values (bottom) of the main transcription factors in immune cells.

