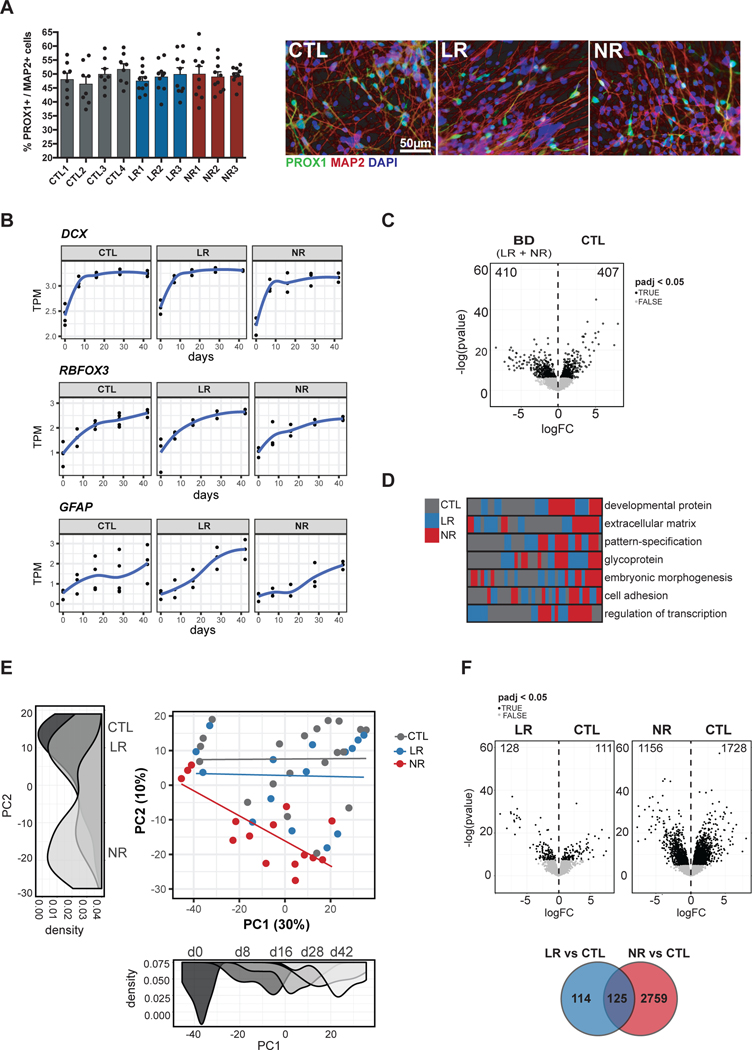
Fig. 1.
NR neurons became transcriptionally distinct during differentiation. a Representative images of immunostainings and quantification of the fraction of neurons expressing the hippocampus DG cell marker PROX1 in the total population expressing the pan neuronal marker MAP2 at 28 days post-differentiation. PROX1 expression was detected using a lentivirus expressing eGFP under the control of PROX1 promoter. Data represent mean ± SEM for n=8–10 randomized images. b RNA-seq expression of neuronal markers (DCX and RBFOX3) and glial marker (GFAP) throughout differentiation starting from NPC (day 0) until day 42. c Differential expression results from all BD patients versus CTL days 8–42. d Sample clustering based on functional annotation. Each row is a functional term that is significantly dysregulated between CTL and BD. The rectangles represent the clustering of individual samples based on the gene expression profile for the respective functional term. e Unbiased PCA of all samples. Density plots are shown for each PC and colored by the top variable associated with the respective axis. PC1 = day, PC2 = disorder subtype. f-top Differential expression results from LR (left) or NR (right) versus CTL days 8–42. f-bottom Overlap between DEGs identified after comparing LR and CTL or NR and CTL.

