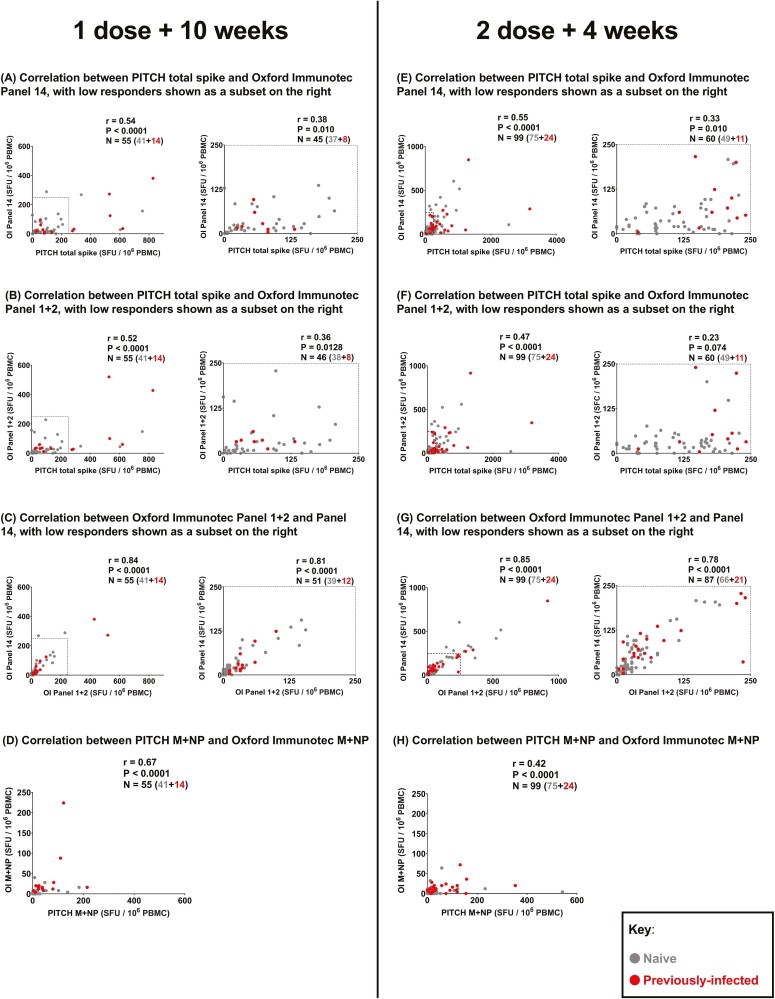
Figure 2:
Correlation between T-cell responses to SARS-CoV-2 spike and structural proteins measured by in-house PITCH ELISpot and OI T-SPOT assay. (A–C) Correlation between T-cell responses to SARS-CoV-2 spike protein measured at 1 dose + 10 weeks timepoint by three different panels: PITCH total spike, Oxford Immunotec Panel 1 + 2 and Oxford Immunotec Panel 14. n = 55 (n = 41 naïve, n = 14 previously infected). (A) Correlation between PITCH total spike and Oxford Immunotec Panel 14 at 1 dose + 10 weeks, with low responders (≤250 SFC/106 PBMC) delineated by a dotted-line in the graph on the left and represented in the graph on the right (n = 45 total; n = 37 naïve and n = 8 previously-infected). (B) Correlation between PITCH total spike and Oxford Immunotec Panel 1 + 2 at 1 dose + 10 weeks, with low responders (≤250 SFC/106 PBMC) delineated by a dotted-line in the graph on the left and represented in the graph on the right (n = 46 total; n = 38 naïve and n = 8 previously-infected). (C) Correlation between Oxford Immunotec Panel 1 + 2 and Panel 14 at 1 dose + 10 weeks, with low responders (≤250 SFC/106 PBMC) delineated by a dotted-line in the graph on the left and represented in the graph on the right (n = 51 total; n = 39 naïve, n = 12 previously-infected). (D) Correlation between T-cell responses to SARS-CoV-2 membrane and nucleocapsid (M + NP) protein at 1 dose + 10 weeks timepoint measured by PITCH ELISpot and Oxford Immunotec T-SPOT. n = 55 (n = 41 naïve, n = 14 previously infected). (E–G) Correlation between T-cell responses to SARS-CoV-2 spike protein measured at 2 doses + 4 weeks timepoint by three different panels: PITCH total spike, Oxford Immunotec Panel 1 + 2 and Oxford Immunotec Panel 14. n = 99 (n = 75 naïve, n = 24 previously infected). (E) Correlation between PITCH total spike and Oxford Immunotec Panel 14 at 2 doses + 4 weeks, with low responders (≤250 SFC/106 PBMC) delineated by a dotted-line in the graph on the left and represented in the graph on the right (n = 60 total; n = 49 naïve and n = 11 previously infected). (F) Correlation between PITCH total spike and Oxford Immunotec Panel 1 + 2 at 2 doses + 4 weeks, with low responders (≤250 SFC/106 PBMC) delineated by a dotted-line in the graph on the left and represented in the graph on the right (n = 60 total; n = 49 naïve and n = 11 previously infected). (G) Correlation between Oxford Immunotec Panel 1 + 2 and Panel 14 at 2 doses + 4 weeks, with low responders (≤250 SFC/106 PBMC) delineated by a dotted-line in the graph on the left and represented in the graph on the right (n = 87 total; n = 66 naïve, n = 21 previously infected). (H) Correlation between T-cell responses to SARS-CoV-2 membrane and nucleocapsid (M + NP) protein at 2 doses + 4 weeks timepoint measured by PITCH ELISpot and Oxford Immunotec T-SPOT. n = 99 (n = 75 naïve, n = 24 previously infected). (A–H) Spearman’s r correlation was performed and two-tailed P values reported (α = 0.05). Infection status at time of first vaccine, as defined by available PCR and serology data: grey symbols = naïve HCWs and red symbols = HCWs previously infected with SARS-CoV-2.

