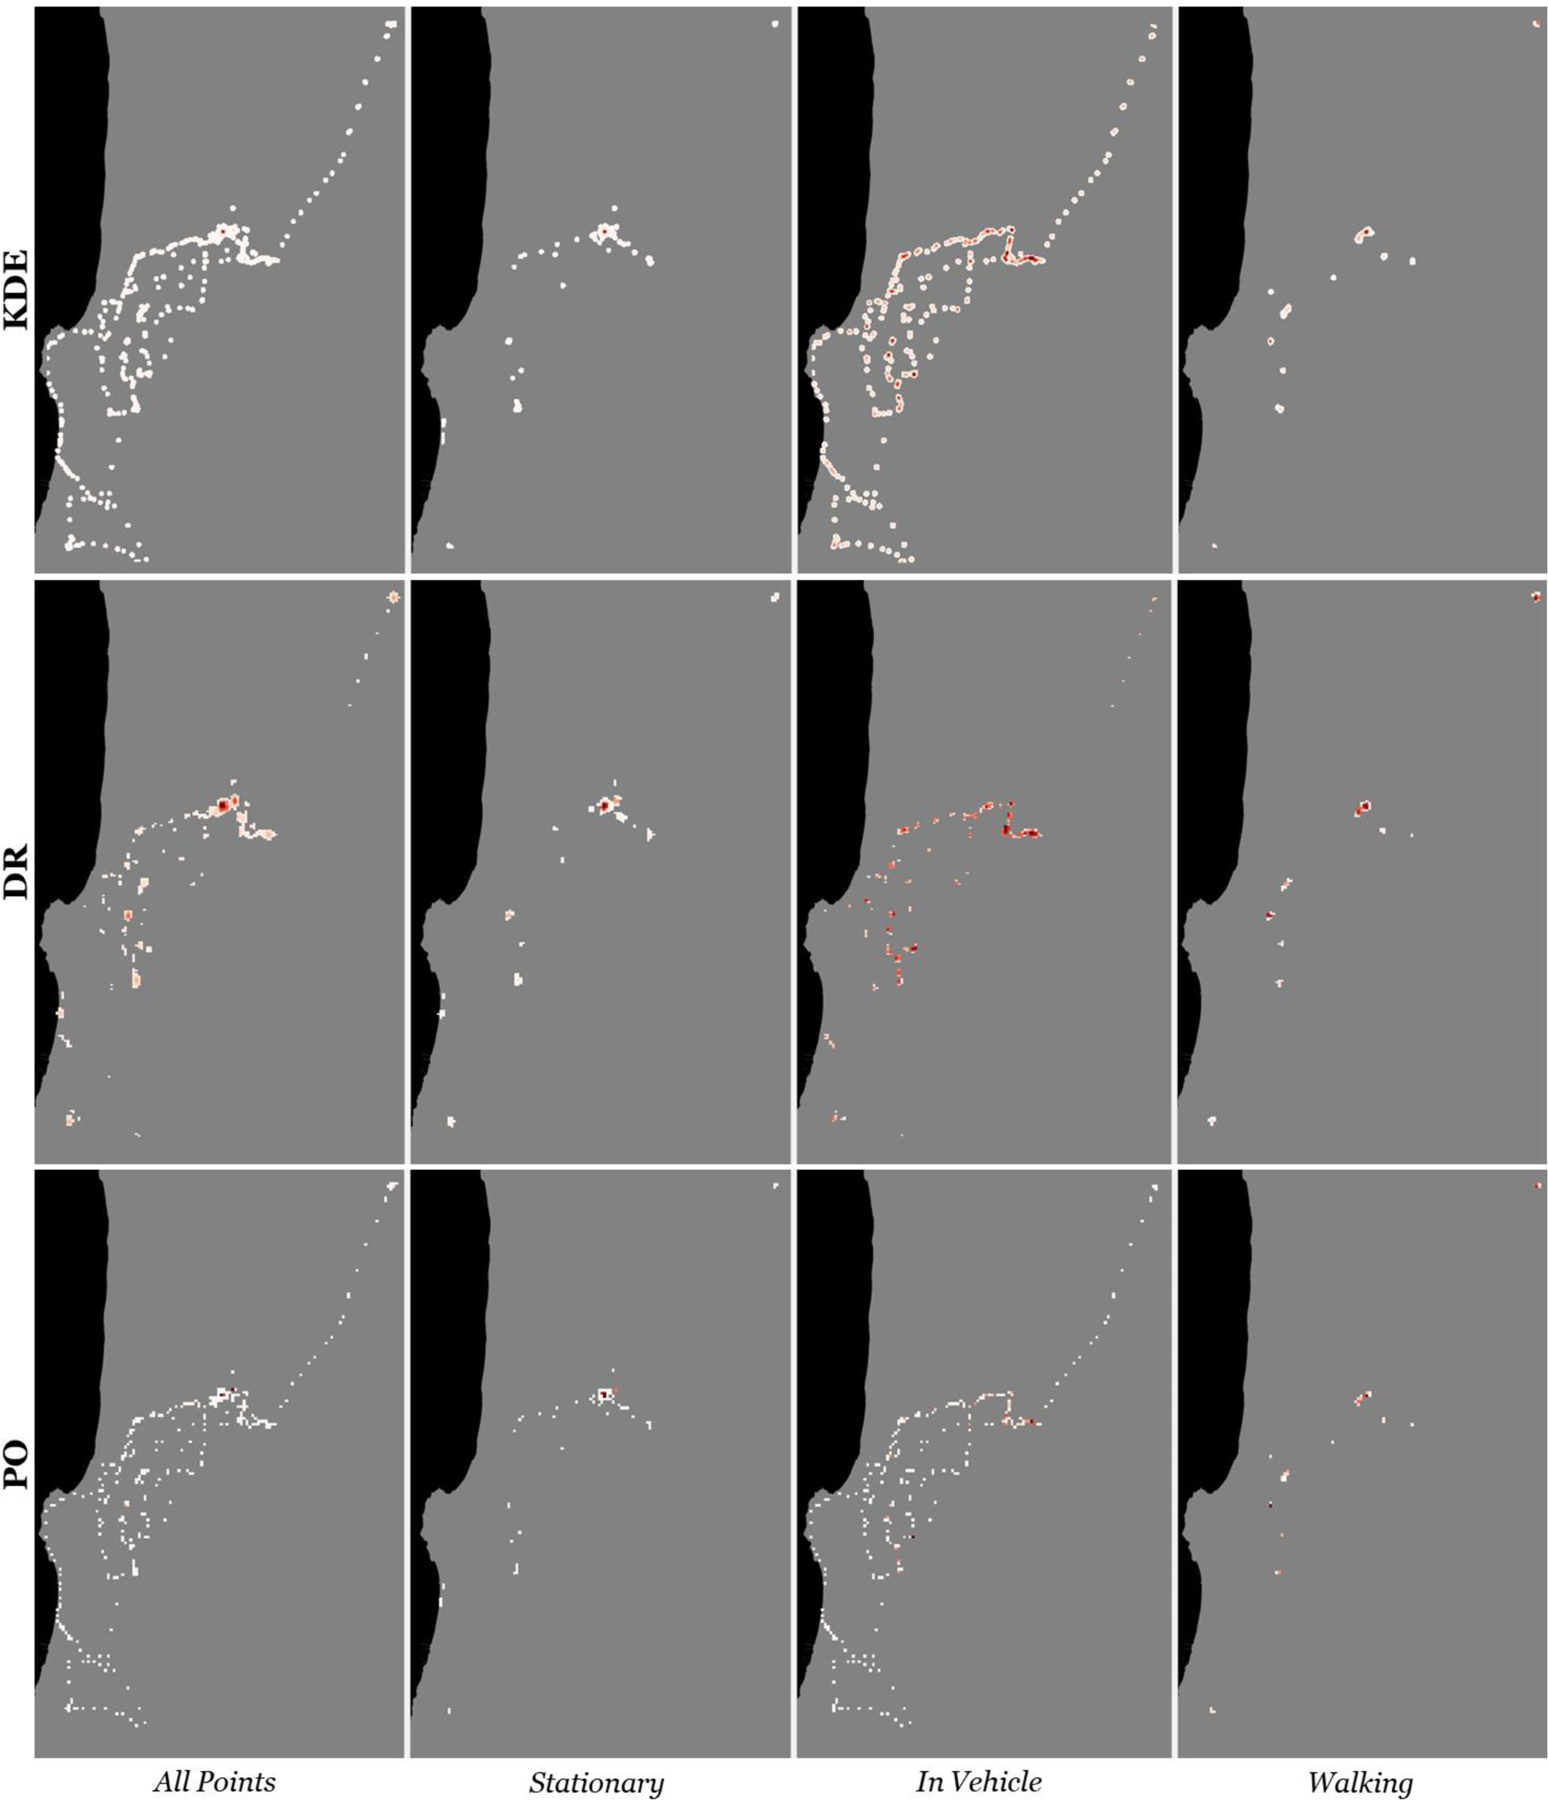
Figure 2.

Time-weighted activity space surface calculated for one participant. Rows represent different TWSA methods (KDE, DR, PO) and columns represent activity data inputs (AllPoints, Stationary, InVehicle, Walking). Areas with darker red indicate greater weighted time spent in location during the study period for a particular data type.
